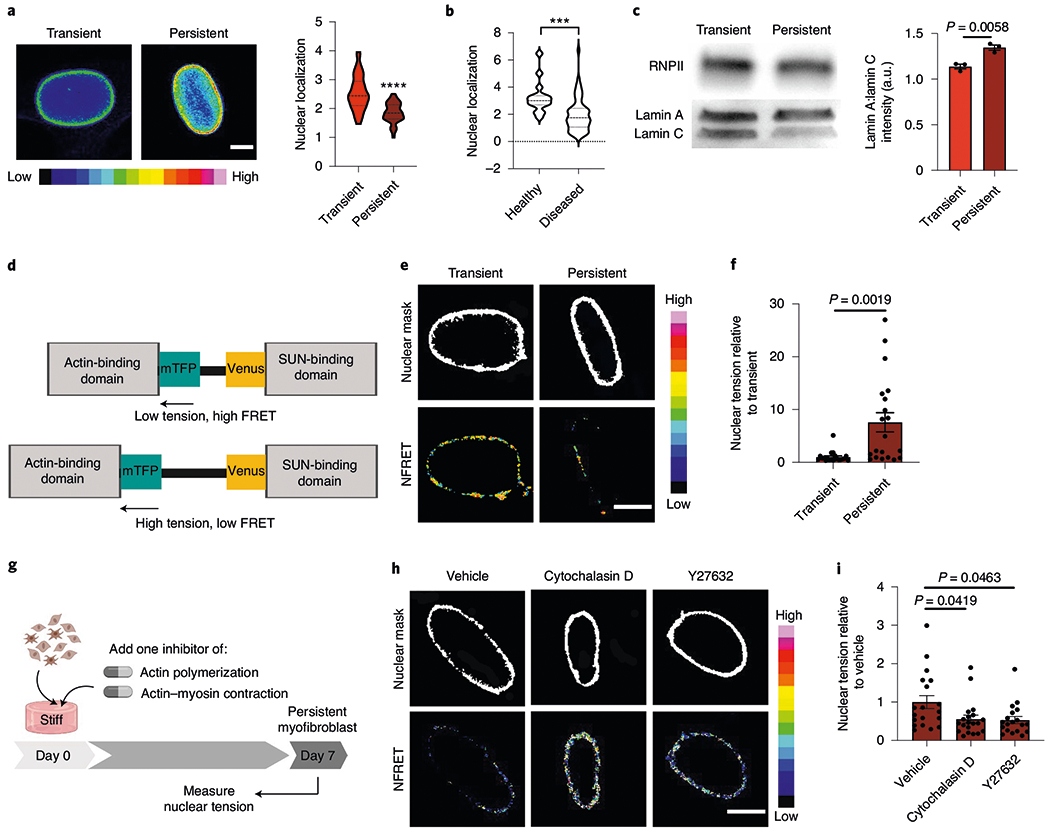
Fig. 6 |. The actin cytoskeleton increases nuclear tension to promote myofibroblast persistence.

a, Images (left) and quantification of the spatial localization of lamin AC (right) in the nuclei of transient (1 d stiff) and persistent myofibroblasts (7 d stiff; n = 200 images per hydrogel). Scale bar, 5 μm. Two-tailed Student’s t-test; n = 40 (transient) and 63 (persistent) cells. b, Spatial localization of lamin AC in human fibrotic and healthy aortic valve tissue. Two-tailed Student’s t-test; n = 15 (healthy) and 59 (diseased) cells. In a,b, nuclear localization was determined as the ratio of the average intensity of the nuclear periphery to the average intensity of the nuclear centre. c, Western blot (left) and quantification of the lamin AC protein expression for transient (1 d stiff) and persistent (7 d stiff) myofibroblasts (right). Uncropped blots can be found in Supplementary Fig. 16. Two-tailed Student’s t-test; n = 3 hydrogels. d, Schematic for the nesprin-tension sensor. e, NFRET images from transient (1 d stiff; left) and persistent myofibroblasts (7 d stiff, right; n = 40 images across four hydrogels per condition). Scale bar, 2.5 μm. f, Nuclear tension measured by inverse NFRET measurements for transient (1 d stiff) and persistent (7 d stiff) myofibroblasts. Two-tailed Student’s t-test; n = 21 (transient) and 20 (persistent) cells. g, Schematic of the cell culture experiment to test whether actin inhibition changes the nuclear forces. h, NFRET images of persistent myofibroblasts treated with vehicle, cytochalasin D and Y27632 (7 d stiff + drug; n = 75 images across four hydrogels per condition). Scale bar, 5 μm. i, Nuclear tension measured by inverse NFRET measurements for persistent myofibroblasts treated with vehicle, cytochalasin D and Y27632 (7 d stiff + drug). One-way ANOVA with Bonferroni’s post-hoc test; n = 19 (vehicle and Y27632) and 20 (cytochalasin D) cells. Data from three biologically independent replicates. ***P < 0.001; ****P < 0.0001. Data reported as the mean ± s.e.m.
