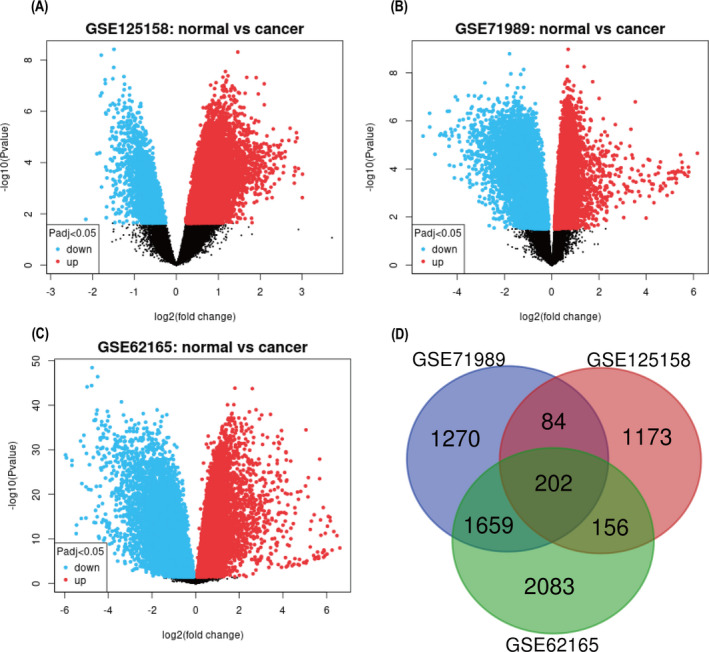
FIGURE 1.

Volcano plots of genes that are different expressions between PDA tissues and noncancerous samples. Each symbol represents a different gene. The red color of the symbols means upregulated, whereas the green color of the symbols means downregulated, and dark color represents not significantly changed genes. X‐axis is log2‐fold changes of genes in PDA compared with normal pancreas samples. Y‐axis is‐log10 (p‐values). (A) Volcano plots of GSE125158. (B) Volcano plots of GSE71989. (C) Volcano plots of GSE62165. (D) Venn diagram. The DEGs were selected with a fold change ≥1 and p‐value <0.05 among the mRNA expression profile sets GSE125158, GSE71989, and GSE62165. The three datasets showed an overlap of 202 genes. DEGs, differentially expressed genes; PDA, pancreatic ductal adenocarcinoma
