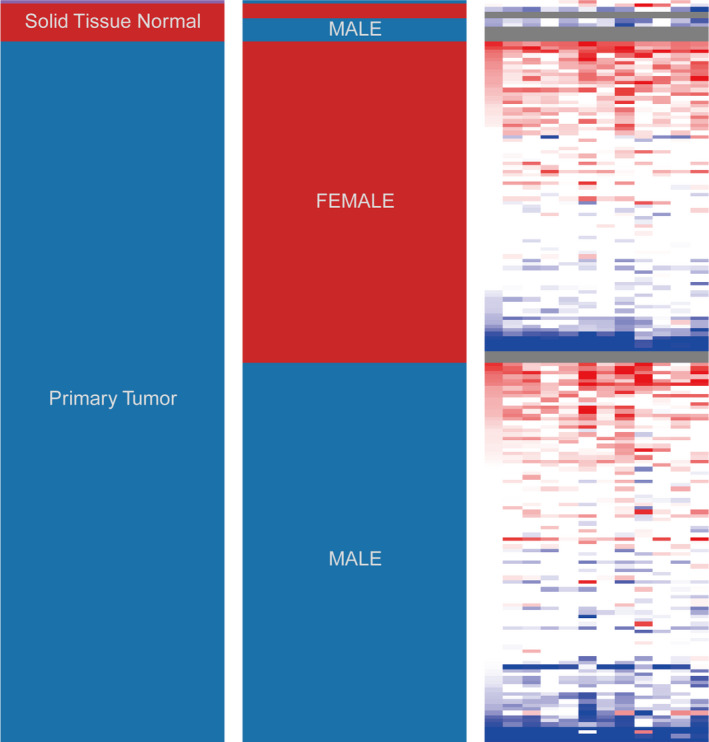
FIGURE 4.

Hierarchical clustering of hub genes was constructed using UCSC Xena. The samples under the pink bar are noncancerous samples, and the samples under the blue bar are PDA samples. Upregulation of genes is marked in red; downregulation of genes is marked in blue. PDA, pancreatic ductal adenocarcinoma
