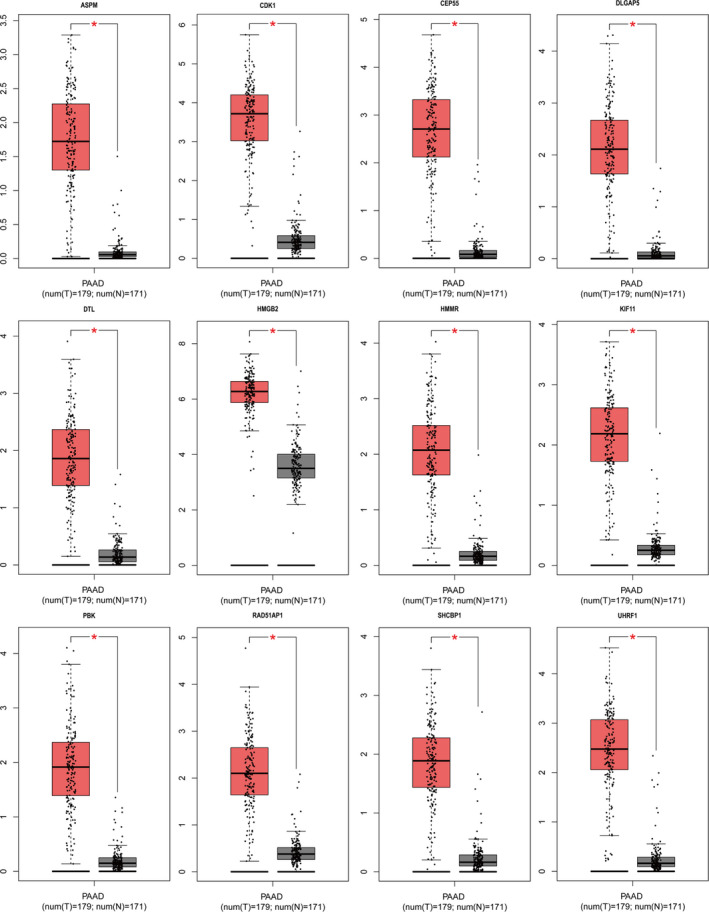
FIGURE 5.

The expression of 12 hub genes in PDA samples and noncancerous samples through GAPIA database (*p < 0.01). All hub genes were upregulated in the tumors of patients with PDA. Red represents tumor tissue and black represents normal tissue. PAAD or PDA, pancreatic ductal adenocarcinoma; GAPIA, gene expression profiling interactive analysis
