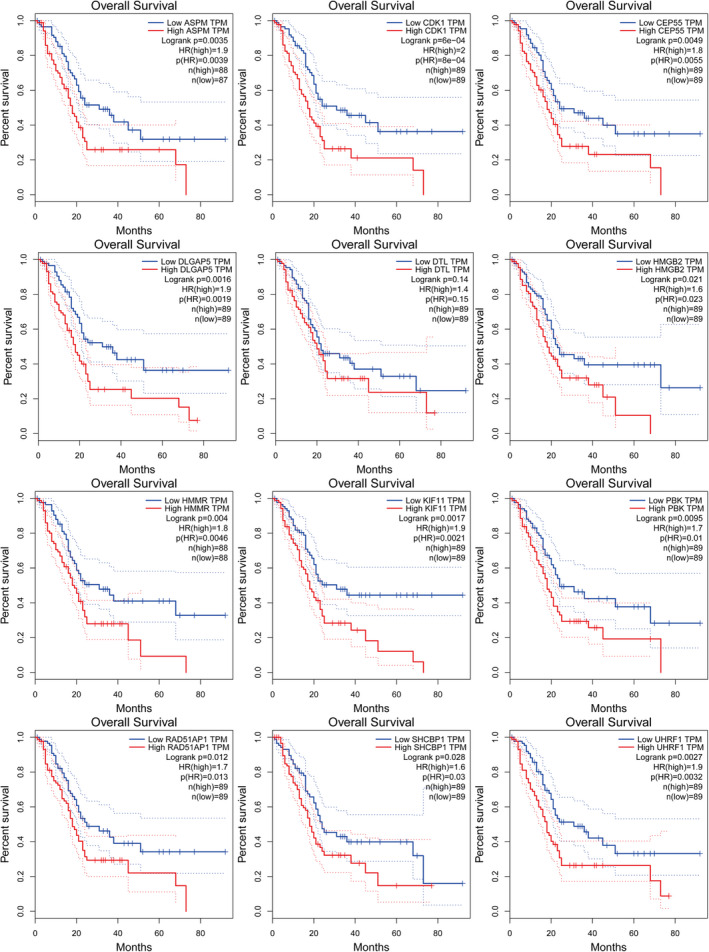
FIGURE 6.

Kaplan‐Meier survival curve analysis. The overall survival of twelve hub genes (HMMR, CEP55, CDK1, UHRF1, ASPM, RAD51AP1, DLGAP5, KIF11, SHCBP1, DTL, PBK and HMGB2) expression in PAD using GEPIA. Red line depicts genes with higher expression associated with poor overall survival and blue line depicts genes with lower expression associated with good survival. PDA, pancreatic ductal adenocarcinoma
