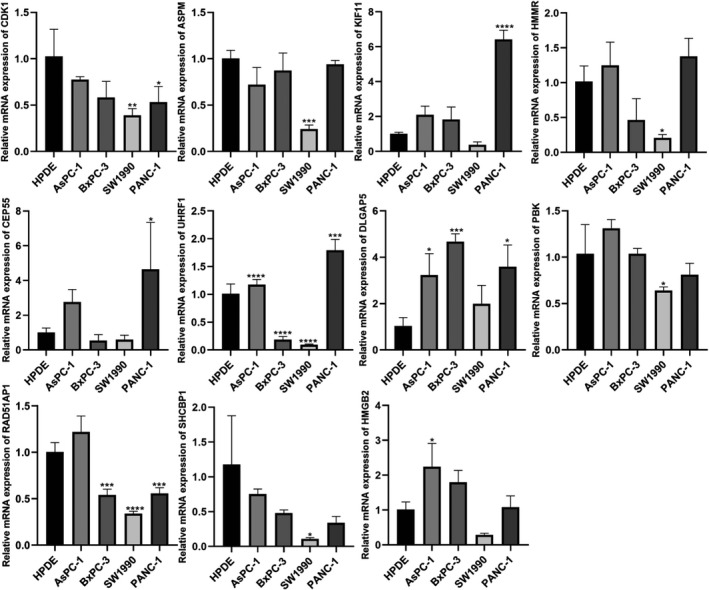
FIGURE 7.

Results of quantitative real‐time PCR revealed that CDK1, ASPM, KIF11, HMMR, CEP55, UHRF1, DLGAP5, PBK, RAD51AP1, SHCBP1, and HMGB2 transcription levels in four cancerous cell lines (AsPC‐1, SW1990, PANC‐1, BxPC‐3) and benign cells (HPDE). *p < 0.05, **p < 0.01, ***p < 0.001, ****p < 0.0001
