Fig. 4.
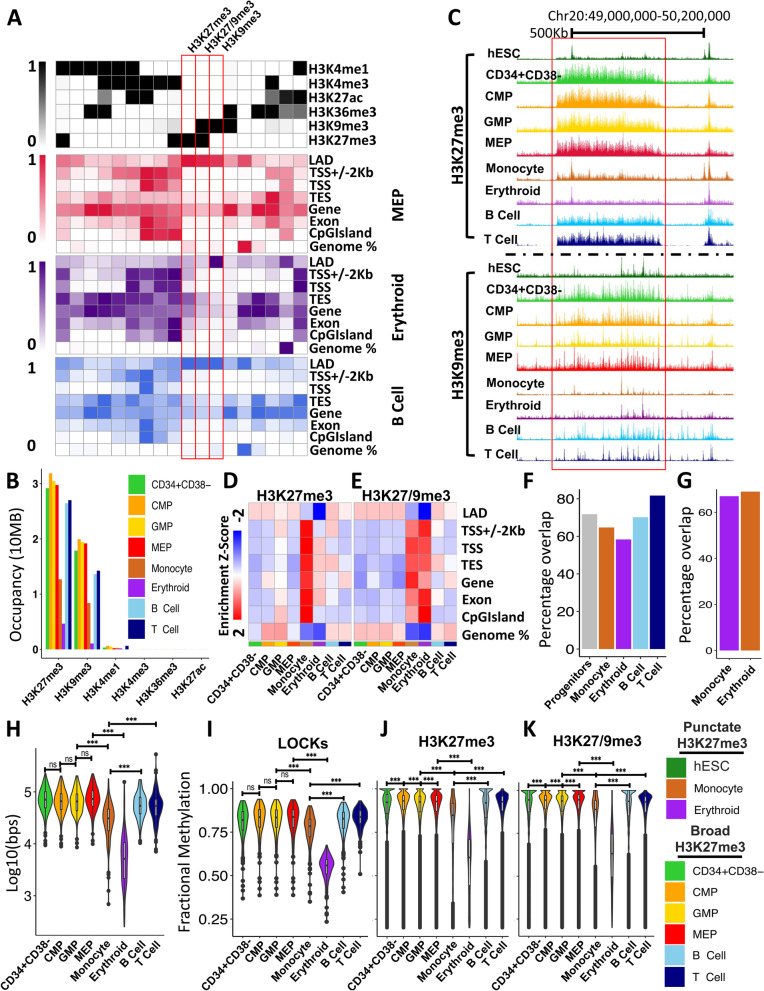
H3K27me3 LOCKs lost during myeloid differentiation are associated with LADs in CD34+ progenitor cells. A Emission probabilities by histone mark for the 18 states of the ChromHMM chromatin state model across all cell types (upper panel). Emission probabilities are based on ChIP-seq data presented in this study. Enrichment of chromatin states within genomic features for MEPs (red), erythroblasts (purple), and B cells (blue). B Cumulative number of bases marked by indicated histone modification within progenitor population LOCKs as indicated by the color legend (bottom right). C Genome browser view of H3K27me3 and H3K9me3 density on chromosome 20 across cell types indicated by the color legend (bottom left). The red box indicates a H3K27me3 LOCK (FDR < 0.05) present in progenitor cells but lost in monocytes and erythroblasts. ChromHMM derived heatmap of z-score enrichment of identified polycomb-repressed (D) and dually repressed (E) chromatin states at genomic features indicated. F Barplot showing percentage of LOCKs overlapping with laminB binding sites. G Barplot showing percentage overlap of LOCKs lost in monocyte or erythroblasts with laminB binding site. H Violin plot showing occupancy of H3K9me3 (log10(bps)) at LOCKs across all populations as indicated by the color legend (bottom right). Violin plot of fractional CpG methylation levels within progenitors’ LOCKs (I), H3K27me3-enriched regions (J), and regions containing both H3K27me3 and H3K9me3 (K) across all populations as indicated by the color legend (bottom right) (two-sided t-test *** p < 0.001)

