Fig. 6.
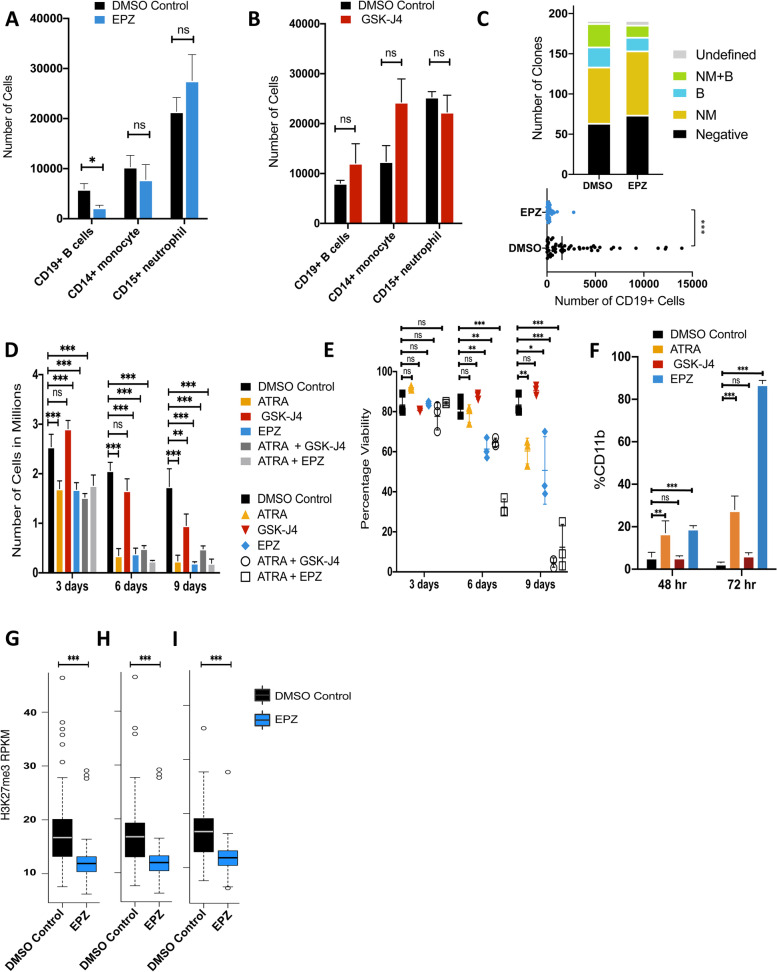
EZH2 inhibition arrests B-lymphoid cell differentiation. Total cell number of CD19+ B cells, CD14+ monocytes, and CD15+ neutrophils after 3 weeks of culturing cordblood-derived CD45highCD34highCD38midCD71-CD10- (P-NML) cells with lymphoid and neutrophil/monocyte lineage-stimulatory cytokines in the presence or absence of EPZ (EZH2 inhibitor) (A) or GSK-J4 (K27me demethylase inhibitor) (B) (N = 6). C Bar plot showing the number of clones with different contents (top panel). M = CD14+ monocytes, N= CD15+ neutrophils, B = CD19+ B cells, negative <10 CD45+ events, undefined = no detectable mature cells. Total number of cells expressing CD19+ (bottom panel). D Total number of HL60 cells in culture after 3, 6, and 9 days of treatment with ATRA, GSK-J4, or EPZ (N=3, Additional file 2: Table S2). E Percentage of viable cells in D (N=3, Additional file 2: Table S2). F Percentage of CD11b+ cells assessed by FACS after 48 and 72 h of treatment with ATRA, GSK-J4, or EPZ. H3K27me3 density at LOCKs identified in HL60 cells (N=3, Additional file 2: Table S3). G LOCKs identified in HL60 cells that overlapped with primary CB progenitor LOCKs (H) and were lost in monocytes (I) (two-sided t-test *p < 0.05, **p < 0.01 and ***p < 0.001)

