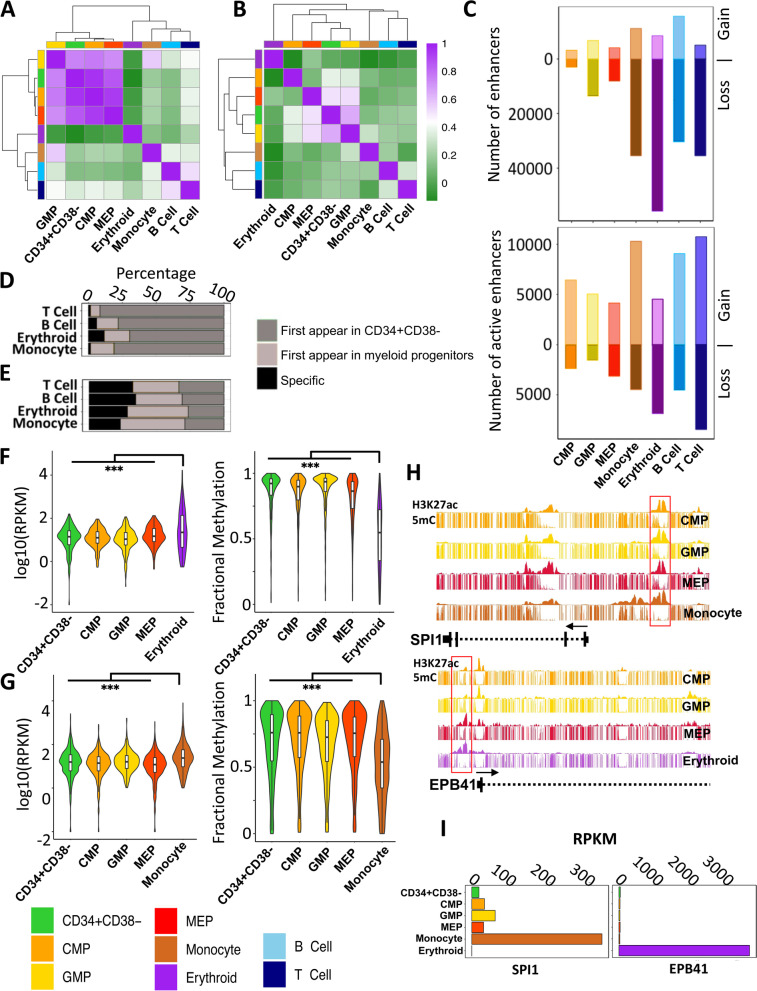
Fig. 7.
A majority of active enhancers in mature myeloid cells are marked by H3K27ac in CD34+ progenitor CB cell populations. Unsupervised hierarchical clustering and a heatmap of pairwise Spearman correlations of H3K4me1 (A) and H3K27ac (B) densities across cell types (color legend shown at bottom left). C Number of total enhancers (top panel) and active enhancers (bottom panel) gained or lost in each cell type compared to CD34+CD38− CB cells. Percentage of enhancers (D) and active enhancers (E) in differentiated cells also in CD34+CD38− cells, myeloid progenitor cells, or uniquely in monocytes, erythroblasts, or B or T cells. Expression of genes (left panel) with active enhancers and fractional DNA methylation at active enhancers in erythroblasts (F) and monocytes (G) also in their inferred parental progenitor populations. H Genome browser view of H3K27ac density at SPI1 (top panel) and EPB41 (bottom panel) locus. I Expression (RPKM) of SPI1 (left panel) and EPB4 (right panel) (Wilcoxon test ***p <0.001)

