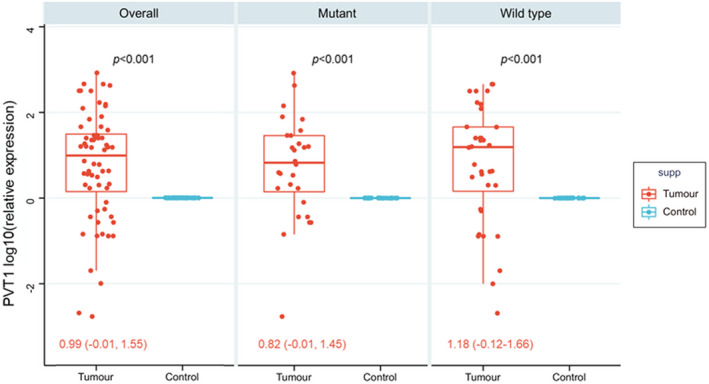
FIGURE 1.

PVT1 gene expression profile in thyroid cancer tissues compared to normal counterparts. Paired t‐test was used to compare cancer and non‐cancer tissues. Overall analysis and stratification by BRAF V600E mutation are shown. All p‐values were <0.001. Fold change was normalized by the GAPDH housekeeping gene. The median and inteq1uartile fold change range of tumor specimens relative to non‐cancer paired tissues are shown
