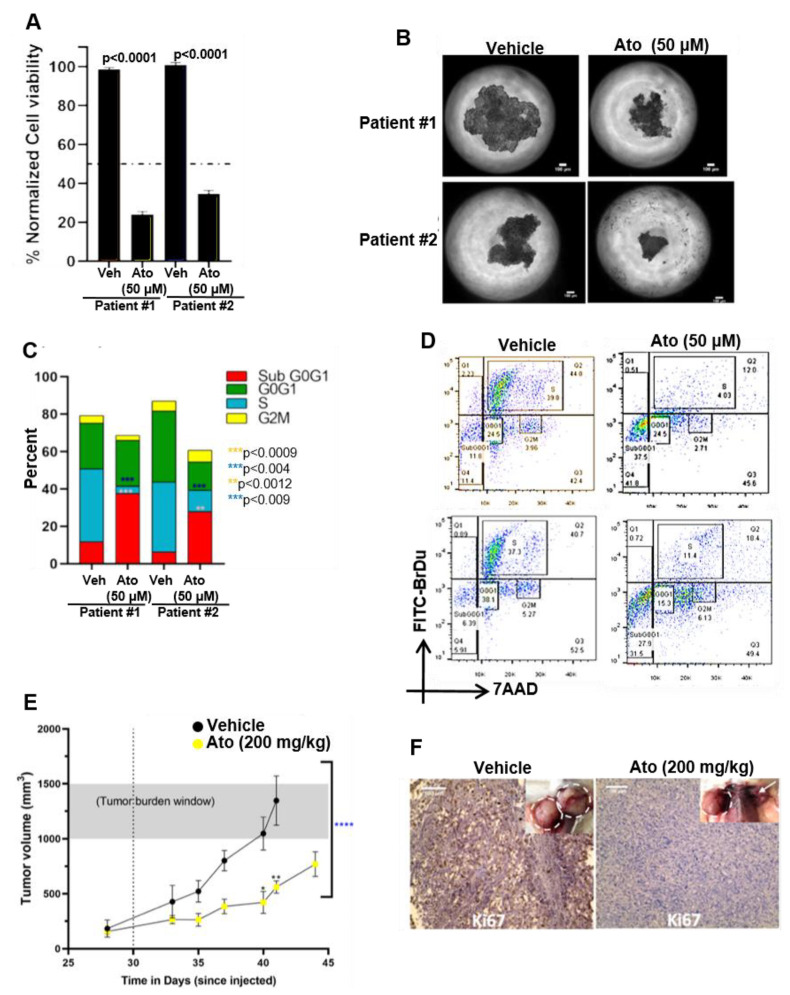
Figure 6.
Atovaquone is effective against patient-derived ovarian cancer stem-like cells. (A) High-grade serous ovarian cancer patient-derived cancer stem-like cell spheroids subjected to 72 h of 50 µM atovaquone (Ato) treatment demonstrated an average of 23.5% and 35.7% viability in patients 1 and 2, respectively, with reduction in viability as compared to respective vehicle (Veh) controls (measured by MTT fluorescence). (B) Phase contrast demonstrates the decreased spheroid area after 72 h of 50 µM atovaquone treatment. Scale bar = 100 µm. (C) Cell cycle flow cytometry analysis (BrdU-FITC and 7-AAD) of spheroids subjected to 50 µM atovaquone treatment demonstrate increased population of cells undergoing apoptosis in both patient samples (Sub G0–G1 phase) as compared to the respective vehicle (Veh) controls. Additionally, a significant decrease in the population of cells in the S phase was observed in both patient samples. Collectively, these data indicate impaired DNA synthesis in response to atovaquone treatment in patient-derived ovarian cancer spheroids. (D) Representative cell cycle analysis for patient-derived ovarian cancer spheroids further illustrates the significant increase in Sub G0–G1 and decrease in S phase of atovaquone-treated cells. (E) Tumor initiation and growth kinetics are shown for NSG mice; after the tumor volume reached 100 mm3, the dotted vertical line represents the time when treatment started (day 30 after spheroids were injected). Tumor volumes are significantly different across the two groups, as analyzed by t test (n = 8, **** p < 0.0001, paired t test on saline control vs. atovaquone) and demonstrate major statistical significance at days 40 and 41, measured by two-way ANOVA (n = 8 mice per group, * p < 0.005, ** p < 0.01). The control group shows increased tumor burden (grey shaded area) and reached a humane end point earlier, as compared to atovaquone treatment group. (F) Ki67 immunohistology staining in tumor tissue sections indicates higher Ki67 expression in the saline treated tumors compared to the atovaquone treatment, matching the higher growth rate of tumors (inset) in that group. White dotted circles around the tumors in the insets display differences in tumor sizes at humane endpoint. An arrow in the inset of the atovaquone-treated group indicates a dramatic decrease in tumor size. Scale bar= 100 μm.

