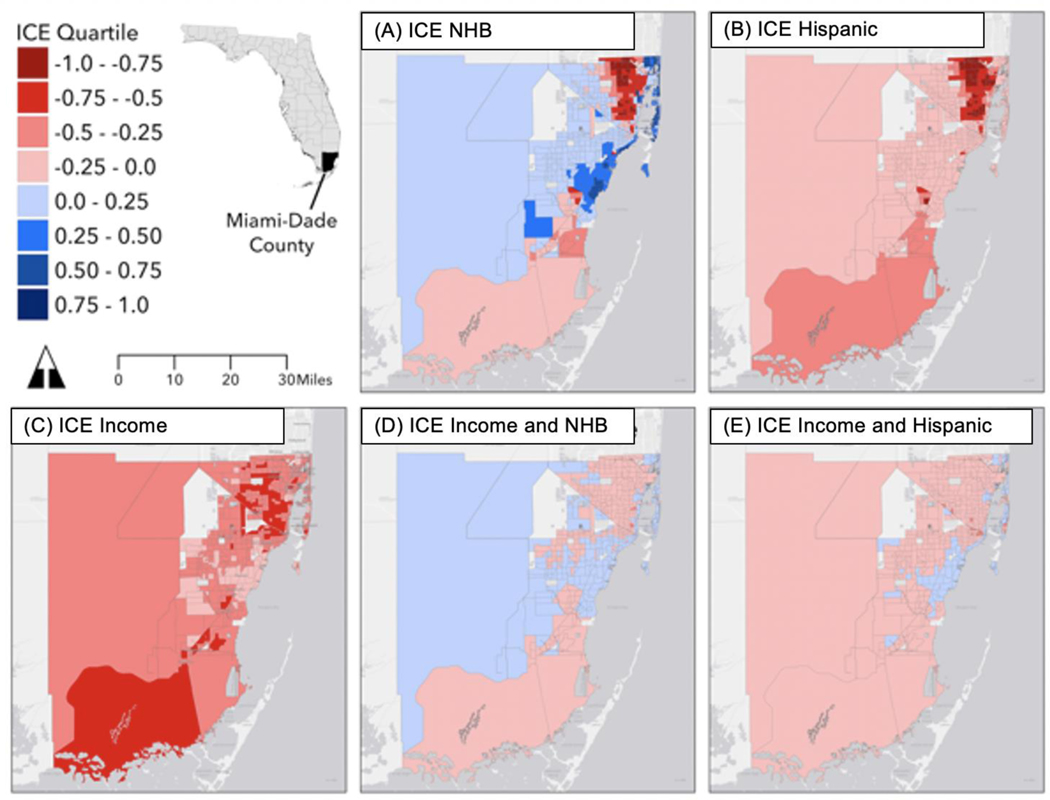
Figure 1: Census Tract-Level Index of Concentration at the Extremes (ICE)a in Miami-Dade County, Florida.
Caption: A) Non-Hispanic Black, (B) Hispanic, (C) Income, (D) Non-Hispanic Black racialized economic segregation, and (E) Hispanic racialized economic segregation. The most privileged and/or most NHW tracts appear in the darkest blue tones, and the least privileged and/or most NHB and Hispanic tracts appear in the darkest red tones.
a ICE ranges from −1, where all households are considered marginalized, to 1, where all households are considered privileged.

