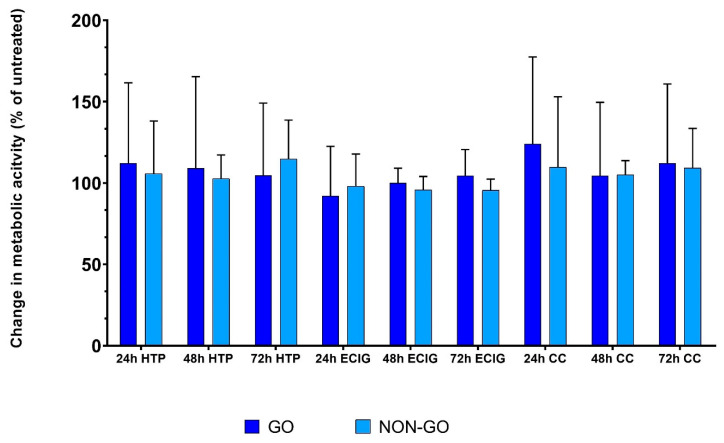
Figure 7.
Metabolic activity of GO and NON-GO OF after 1% HTP, ECIG and CC treatment. There was no difference in the metabolic activity of the cell lines after these treatments. The result are shown as % of untreated (mean ± SD). The data were analyzed using repeated measures ANOVA followed Tukey’s multiple comparisons post hoc test. All experiments were performed in triplicates.

