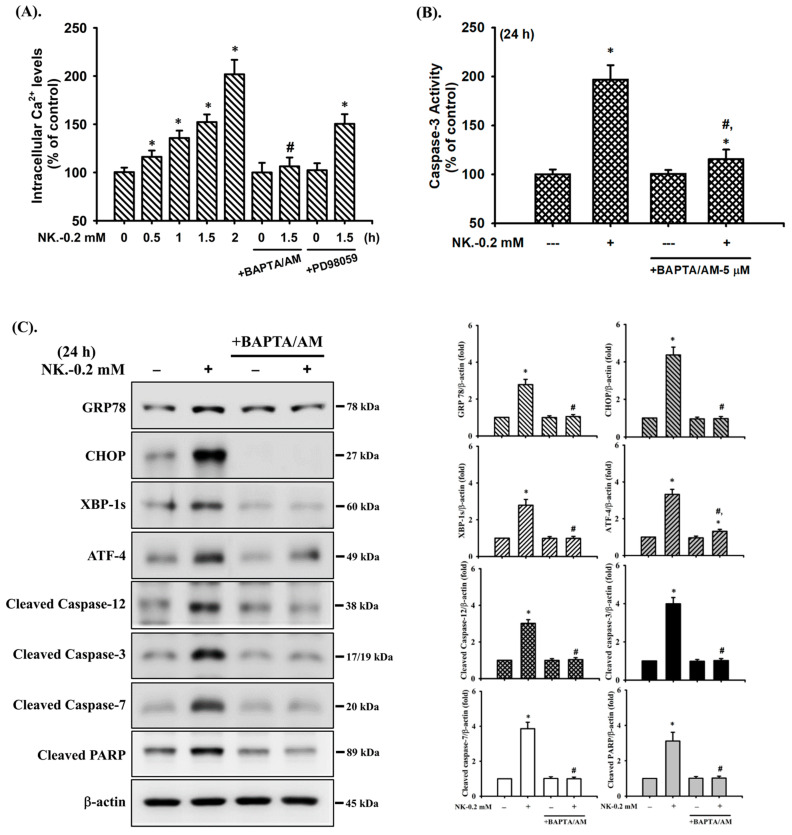
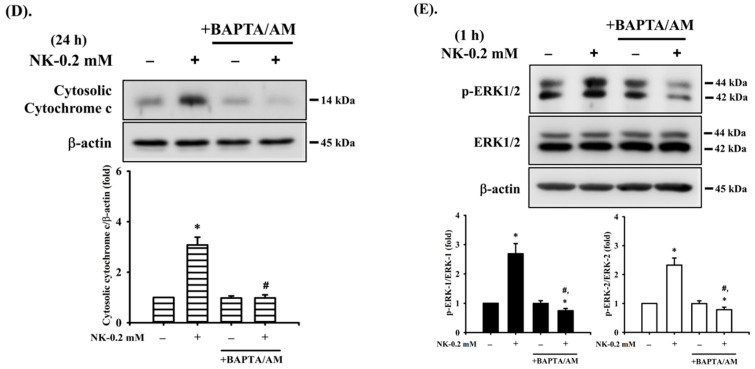
Figure 8.
The role of [Ca2+]i in norketamine (NK)-induced ERK1/2 signal activation and apoptosis in RT4 cells. Cells were treated with NK (0.2 mM) for different time intervals in the absence or presence of BAPTA/AM (5 μM) or PD98059 (20 μM). (A) [Ca2+]i levels were determined using flow cytometry (for 0.5–1.5 h). (B) Caspase-3 activity was detected using the caspase-3 Activity Assay Kit (for 24 h). (C) The levels of protein expression for GRP78, CHOP, XBP-1s, ATF-4, caspase-3, -7, and PARP (for 24 h), (D) the release of cytochrome c form the mitochondria into cytosolic fraction (for 24 h), and (E) the protein phosphorylation for ERK1/2 (for 1 h) were examined using Western blot analysis. Data in (A,B) are presented as the means ± SD of four independent experiments assayed in triplicate. Results shown in (C,D,E) on representative images, and quantification was determined by densitometric analysis. Each bar presented is the mean ± SD of three independent experiments. * p < 0.05 compared to vehicle control. # p < 0.05 compared to NK treatment alone.


