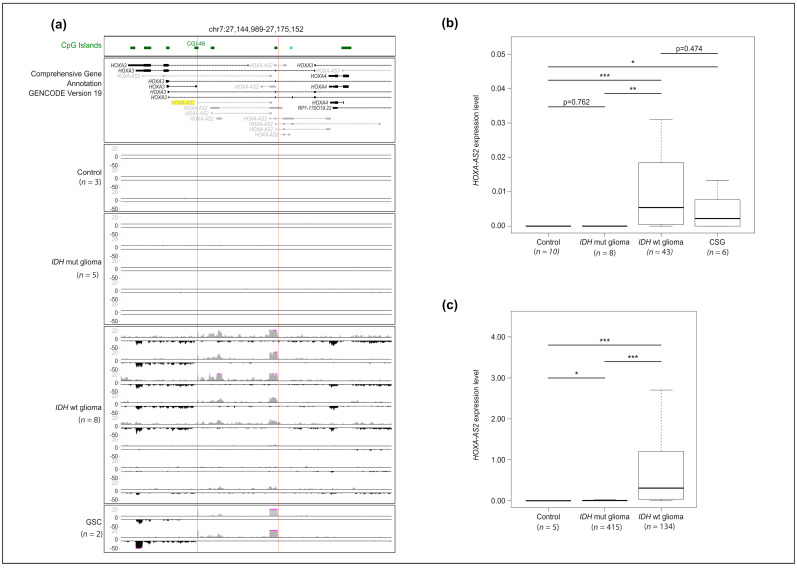
Figure 1.
Expression of the HOXA-AS2 transcript in IDHwt glioma samples and GSC lines. (a) Strand-oriented RNA-seq signals along the genomic region encompassing HOXA-AS2 isoforms in control (n = 3), IDHmut (n = 5) and IDHwt (n = 8) glioma, and Glioma Stem Cell (GSC) (n = 2) samples. For each sample, sense (in black) and antisense (in gray) transcription signals are shown in the lower and upper panels, respectively. The positions of 5′ and 3′ ends, identified using the RACE-PCR approach, in one IDHwt glioma sample are shown by a green and red vertical line, respectively. (b) and (c) Relative expression level of HOXA-AS2 in control, IDHmut and IDHwt glioma, and GSC samples from our cohort analyzed by microfluidic-based RT-qPCR (b) and from the TCGA cohort, analyzed by RNA-seq (c). In (b), values are the fold change relative to the geometrical mean of the expression of the housekeeping genes PPIA, TBP, and HPRT1.* p < 0.05, ** p < 0.01, *** p < 0.001 (Mann-Whitney U-test).

