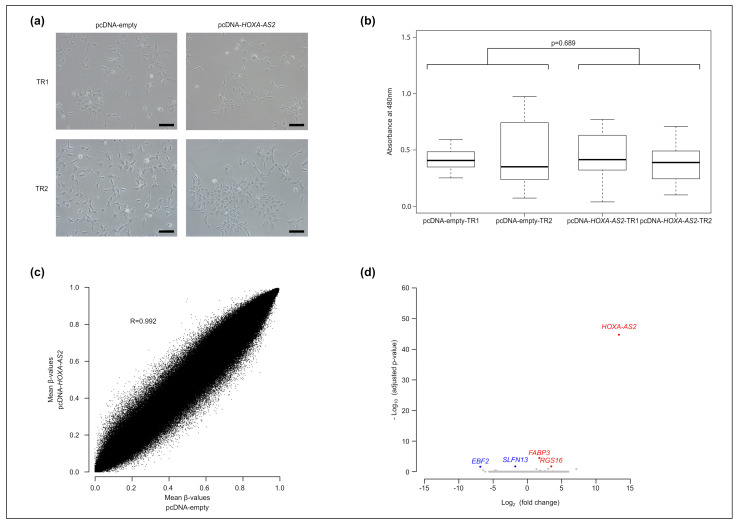
Figure 3.
HOXA-AS2 overexpression in the H9-NSC line. (a) Representative images of the morphology of HOXA-AS2-expressing (right panels; n = 2) and control (left panels, n = 2) H9-NSC lines. These cell lines were obtained from two independent transfections, referred to as TR1 and TR2, respectively. (b) Colorimetric assay (n = 5) to quantify cell proliferation in the two HOXA-AS2-expressing H9-NSC lines and their respective control line. (c) Infinium Methylation EPIC BeadChip data were used to produce scatter plots to correlate DNA methylation patterns of HOXA-AS2-expressing (n = 2) and control (n = 2) H9-NSC lines. (d) Volcano plot of differential gene expression in HOXA-AS2-expressing (n = 2) and control (n = 2) H9-NSC lines.

