Figure 4.
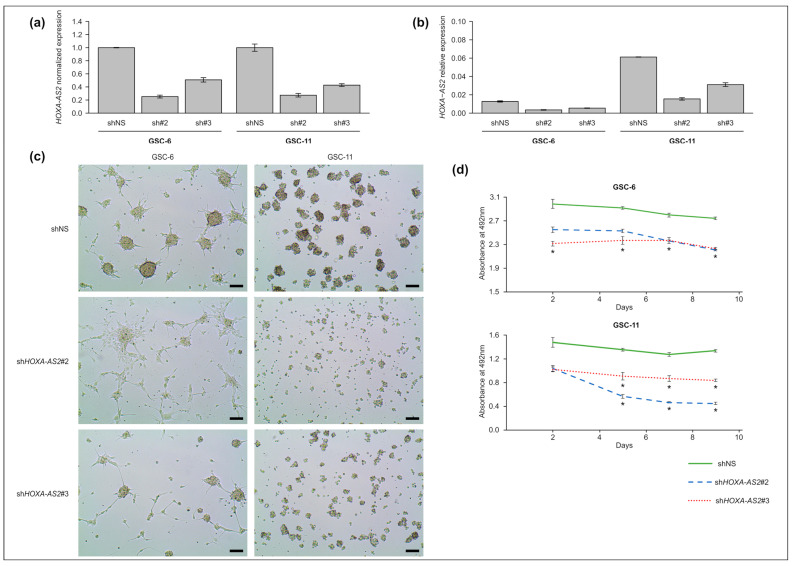
HOXA-AS2 knockdown in GSC lines. (a,b) Relative expression level of HOXA-AS2 in GSC-6 and GSC-11 cells five days after transduction with lentiviruses expressing two different HOXA-AS2 shRNAs (sh#2 and sh#3) or with a nonsilencing shRNA used as control (shNS). Values are the fold change relative to the geometrical mean of expression of the housekeeping genes PPIA, TBP, and HPRT1. Data are presented as relative expression normalized (a) and not normalized (b) to the expression level in shNS cells. (c) Representative images of neurosphere formation in GSC-11 and GSC-6 cells five days after transduction with lentiviruses expressing two different shRNAs (shHOXA-AS2#2, #3) or with a nonsilencing shRNA used as control (shNS). Scale bar = 100 μm. (d) Growth curves of GSC-6 and GSC-11 cells after HOXA-AS2 silencing or not at days 2, 4, 7, and 9 after transduction; * p < 0.05 (Mann–Whitney test).

