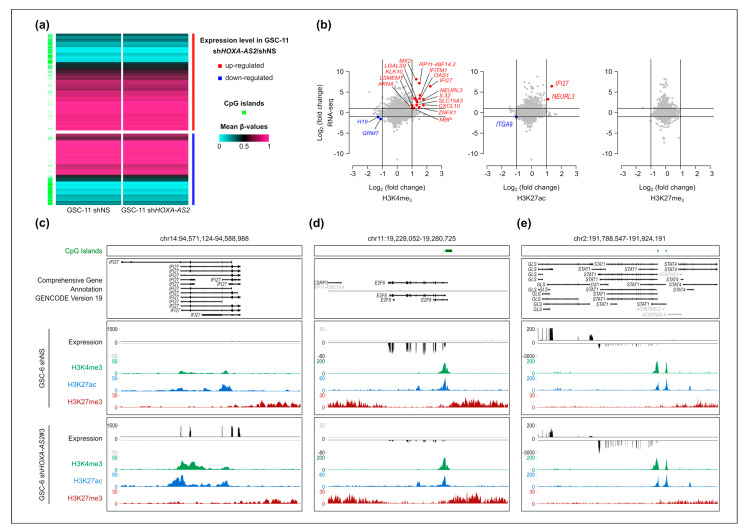
Figure 6.
DNA methylation and histone mark changes at deregulated genes following HOXA-AS2 knockdown. (a) Promoter DNA methylation level (mean β-values) at the 784 genes deregulated (457 up- and 327 downregulated) following HOXA-AS2 knockdown assessed in control GSC-11 cells (shNS) (n = 2) and in silenced cells (Sh-HOXA-AS2) (n = 4). (b) Integrative analysis of changes in gene expression (Log2 FC) and in histone mark enrichment following HOXA-AS2 silencing in GSC-6 cells. Genes with significant changes in gene expression and histone mark profile (Log2 FC > 1 or < − 1; FDR < 0.05) are shown in red (upregulated) and blue (downregulated). (c–e) Genome Browser view at the IFI27 (c), E2F8 (d), and STAT1 (e) loci to show H3K4me3, H3K27ac, and H3K27me3 enrichment, and the strand-oriented RNA-seq signal in GSC-6 cells transduced with lentiviruses expressing shNS or shHOXA-AS2#3.

