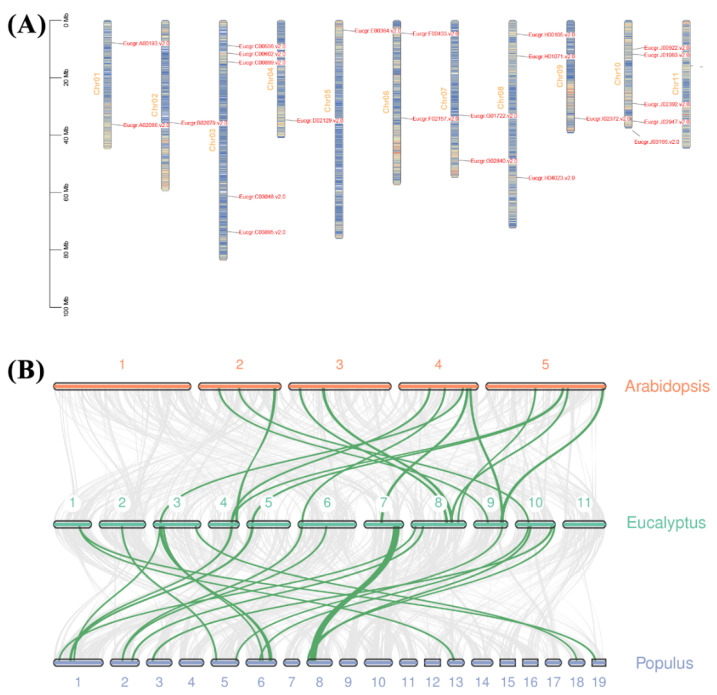
Figure 4.
Distribution of EgrGATA genes on the chromosomes of Eucalyptus grandis and synteny analysis of GATA genes. (A) Chromosomal distributions of EgrGATA genes. Color gradient from blue to red on the chromosomes indicates low to high gene density, respectively. (B) Synteny analyses of GATA genes between Eucalyptus grandis and other module plant species (A. thaliana and P. trichocarpa). Green lines indicate the collinear blocks within Eucalyptus and other plant genomes.

