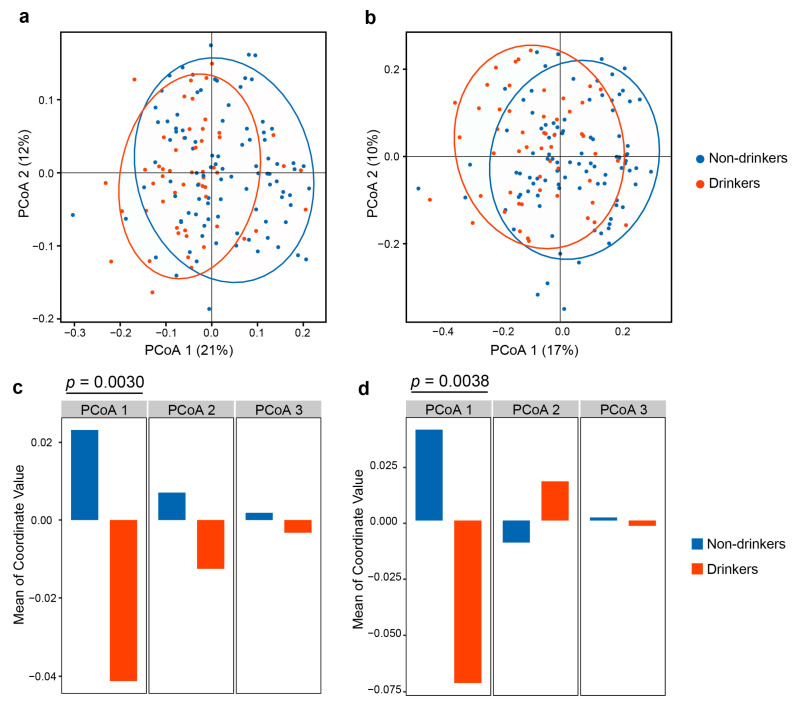
Figure 2.
Beta diversity estimates of the oral microbial community. a, b PCoA based on (a) weighted UniFrac distance matrix and (b) Bray–Curtis distance matrix of the oral microbial communities between non-drinkers and drinkers. (c,d) Bar plots showing the means of the first, second, and third coordinates of PCoA for non-drinkers and drinkers using (c) weighted UniFrac and (d) Bray–Curtis distance matrix. p values were calculated by the linear regression model with controlling age, sex and smoking status.

