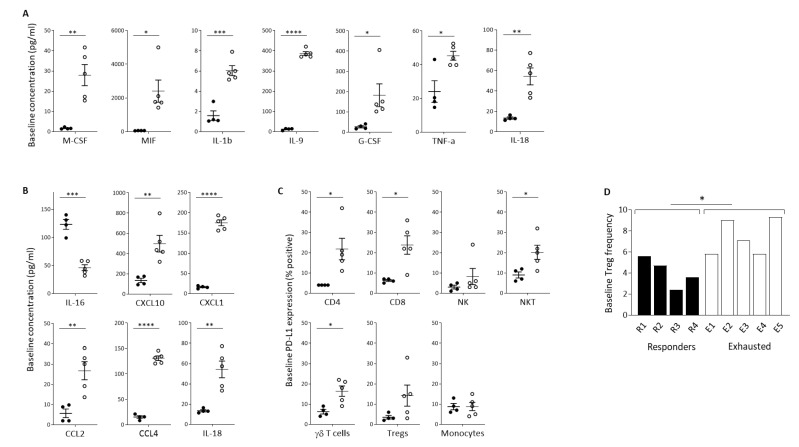
Figure 4.
Baseline indicators of predicted response to Pexa-Vec therapy. Differential baseline levels of (A) inflammatory cytokines and (B) chemokines in patient plasma and (C) PD-L1 expression on immune cell populations in Responder (black; n = 4) and Exhausted (white; n = 5) patient samples. Data is shown as pg/mL (A,B) or % positive expression for D1 pre samples (* p < 0.05, ** p < 0.01, *** p < 0.001, **** p < 0.0001). (D) Relative frequency of Tregs in PBMCs at baseline (D1 pre) in Responder (black; n = 4) and Exhausted (white; n = 5) patients. Data is shown as % Tregs of whole PBMCs; * p < 0.05.

