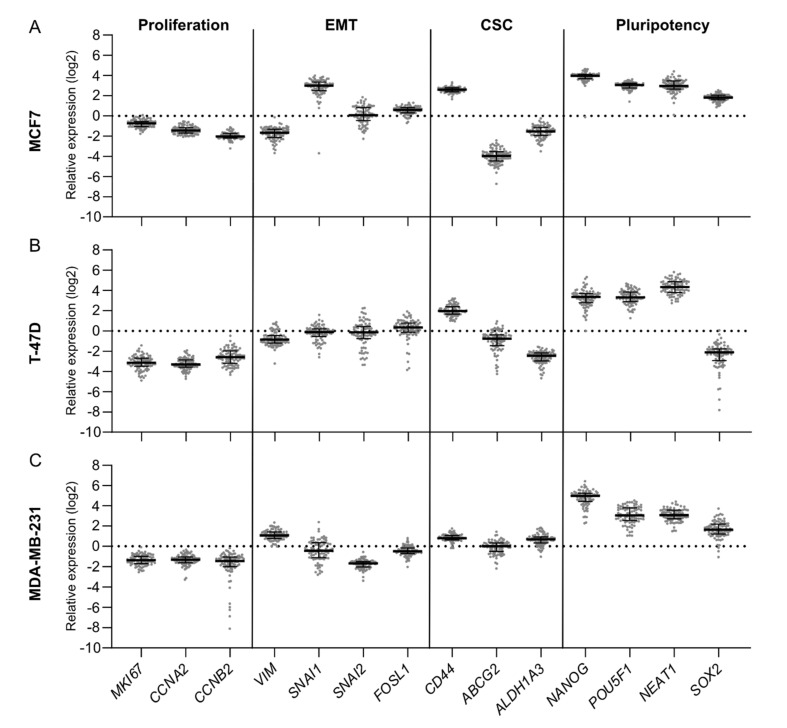
Figure 2.
Gene expression fingerprints of patient-derived scaffolds cultured with different cell lines reveal tissue-specific variations. Individual dots represent relative gene expression of an individual patient-derived scaffold (PDS) (n = 84) grown with either (A) MCF7, (B) T-47D or (C) MBA-MD-231 to gene expression of the same cell line cultured in 2D. Genes related to proliferation, epithelial-mesenchymal transition (EMT), breast cancer stem cells (CSC) and pluripotency were included in the gene panel. Median and interquartile range (IQR) represented by errors bars are plotted. The IQR for each gene was calculated as measurement of the inter-PDS variability (Supplementary Table S3).

