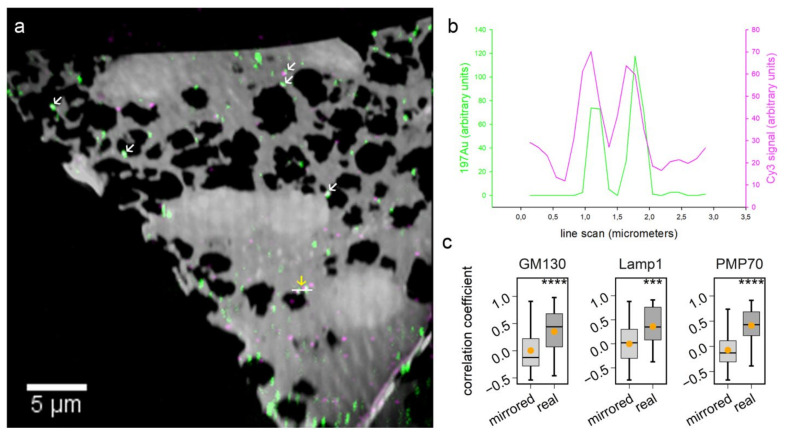
Figure 4.
Correlation of 6 nm Au_Np detected by nanoSIMS and fluorescence signals detected by fluorescent microscopy. (a) Overlay of gold images and fluorescent images for targeting PMP70. Examples of colocalized gold and fluorescent signals are indicated by white arrows. The signal variations of gold and Cy3 along the area indicated by a white horizontal line were extracted and plotted in (b). (c) shows the correlation coefficient between gold and fluorescent images (real) in comparison to that between gold and mirrored fluorescence images (mirrored). Wilcoxon rank sum test: for GM130, lamp1 and PMP70, N = 51, 45 and 50, respectively, and p = 4.9 × 10⁻⁵, 1.3 × 10⁻⁴ and 1.9 × 10⁻⁹, respectively. *** p ≤ 0.001, **** p ≤ 0.0001.

