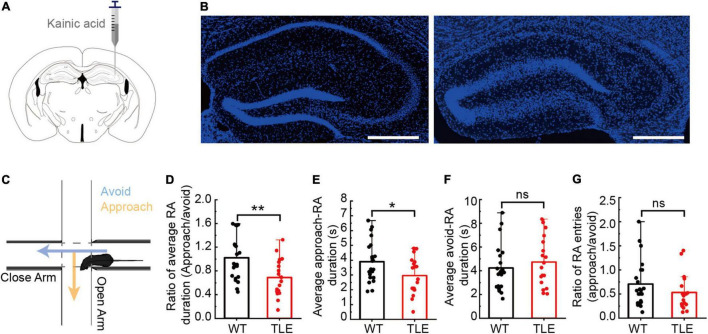
FIGURE 1.
Kainic acid-induced TLE mice showed impairments in the hippocampal cytoarchitecture and RA behavior. (A) Schematic diagram of intrahippocampal kainic acid injection in C57/BL6J mice. (B) Comparison of hippocampal subfields between WT and TLE mice. Scale bar, 500 μm. (C) Schematic diagram of elevated plus maze test and a typical RA. (D) Ratio between average of approach-RA duration and average of avoid-RA duration. (E) Average of approach-RA duration. (F) Average of avoid-RA duration. (G) Ratio between approach-RA and avoid-RA entries (WT, n = 22; TLE, n = 18; ns is no significant difference; error bars represent s.d; *p < 0.05; **p < 0.01, t test).

