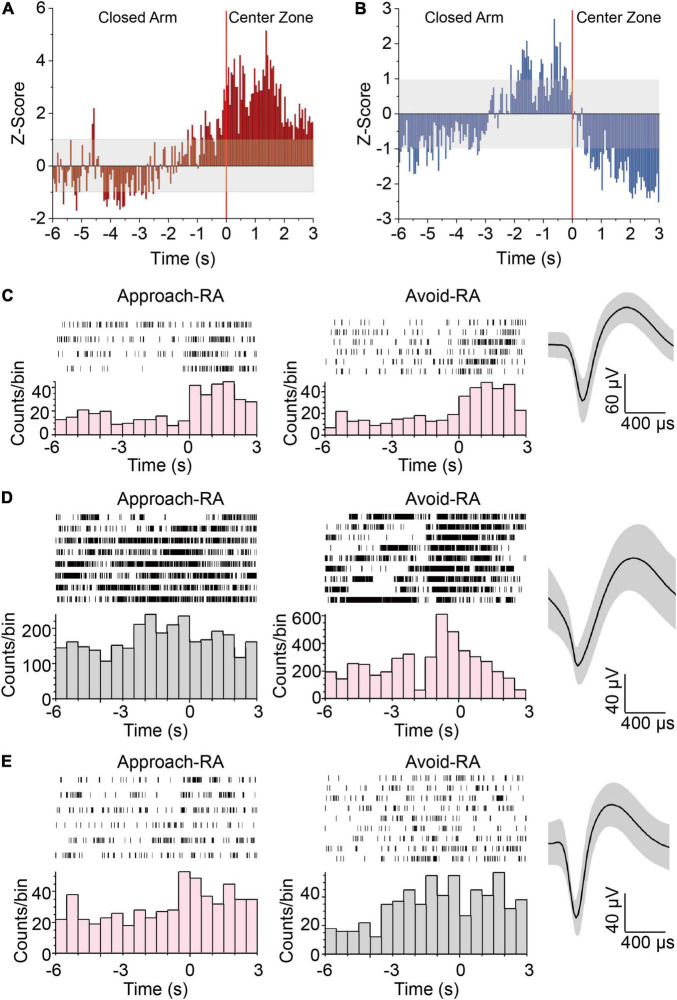
FIGURE 2.
Neurons in HPC responding to approach-RA or avoid-RA selectively. (A,B) Z-scored peri-RA time histograms aligned with onset of RA. (A) n = 57 cells from 5 mice. (B) n = 60 cells from 5 mice. (C) Representative raster plots and waveforms of dDG/CA3 neurons positively responsive to RA. (D) Representative raster plots and waveforms of dDG/CA3 neurons positively responsive to avoid RA. (E) Representative raster plots and waveforms of dDG/CA3 neurons positively responsive to approach RA. Each row in the raster represents a single trial of RA behavior. Averaged spike waveforms of the representative neuron were provided at the left panels. Bin = 0.5 s.

