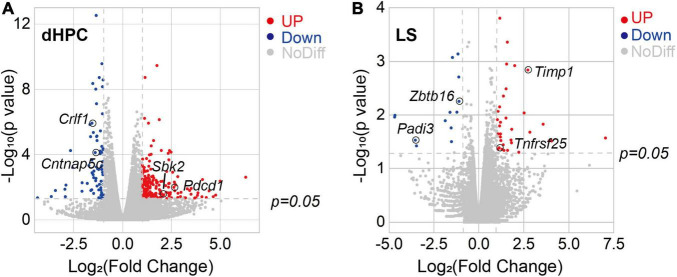
FIGURE 4.
Kainic acid-induced TLE mice showed transcriptome alterations in the hippocampus and lateral septum. (A) Volcano plot of relative RNA expression in DG/CA3 from TLE mice as compared to WT mice. (B) Volcano plot of relative RNA expression in dLS from TLE mice as compared to WT mice [Genes in upper left and right quadrants are significantly differentially expressed. Red dots, up-regulation (dHPC, 65 genes; LS, 34 genes), blue dots, down-regulation (dHPC, 224 genes; LS, 11 genes). WT, n = 4 mice; TLE, n = 6 mice. p < 0.05].

