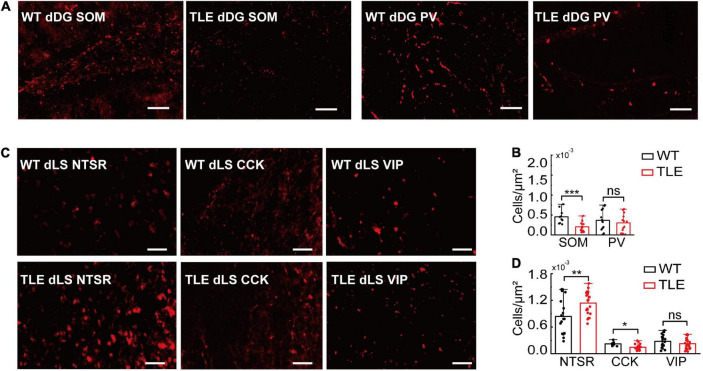
FIGURE 5.
Comparison of GABAergic neurons subtypes in WT vs. TLE. (A) Representative images of immunostaining of PV+ and SOM+ neurons in dDG of WT and TLE mice. Scale bar, 200 μm. (B) The densities of SOM+ and PV+ neurons in dDG/CA3 (SOM+: WT, n = 6 mice, TLE, n = 6 mice; PV+: WT, n = 6 mice, TLE, n = 5 mice). (C) Representative images of immunostaining of NTSR+, CCK+, and VIP+ neurons in dLS of WT and TLE mice. Scale bar, 200 μm. (D) The densities of NTSR+, CCK+, and VIP+ neurons in dLS (NTSR+: WT, n = 11 mice, TLE, n = 10 mice; CCK+: WT, n = 6 mice, TLE, n = 9 mice, VIP+: WT, n = 11 mice, TLE, n = 6 mice) (Error bars represent s.d; *p < 0.05; **p < 0.01, ***p < 0.001, t-test).

