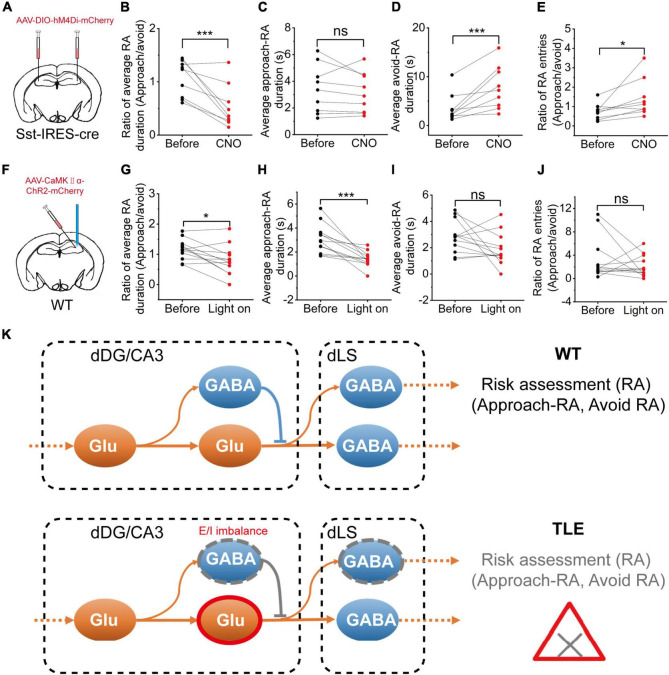
FIGURE 6.
Chemogenetic inhibition of hippocampal SOM+ neurons or optogenetic activation of CaMKII+ neurons impaired the RA of mice. (A) Diagram showing the chemogenetic inhibition of CA3 SOM+ neurons; (B) Ratio between the mean approach- and avoid-RA durations; (C) Average approach-RA duration; (D) Average avoid-RA duration; (E) Ratio between approach- and avoid-RA entries (before CNO, n = 9; CNO, n = 9; error bars represent standard deviation (s.d.); *p < 0.05; ***p < 0.001, paired t-test); (F) Diagram of the experimental setup for optogenetic stimulations; (G–J) Optogenetic activation of hippocampal glutamatergic neurons; (G) Ratio between the mean approach- and avoid-RA durations; (H) Average approach-RA duration; (I) Average avoid-RA duration; (J) Ratio between approach- and avoid-RA entries (before light, n = 12; light on, n = 12; error bars represent standard deviation (s.d.); ***p < 0.001, paired t-test); and (K) A supposed model of neural E/I imbalance mechanism in impairment of approach-RA in TLE. ns, no significant difference.

