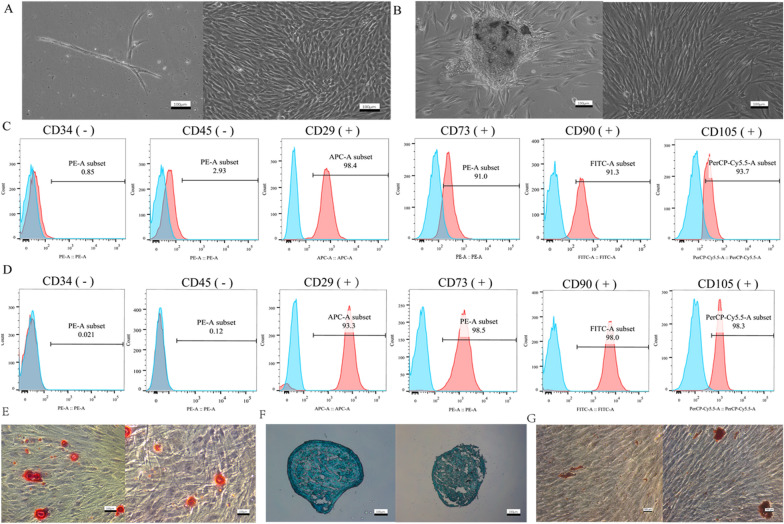
Fig. 2.
Cell culture and identification. A Primary and passage 4 DPSCs from left to right. B Primary culture and 4th passage PDLSCs from left to right. C Surface markers of DPSCs were analyzed by flow cytometry. D Surface markers of PDLSCs were tested by flow cytometry. The blue part represented the control (unstained cell). E Result of ARS staining of DPSCs and PDLSCs from left to right. F Result of Alcian blue staining of DPSCs and PDLSCs from left to right. G Result of Oil red O staining of DPSCs and PDLSCs from left to right. Scale bar, 100 μm

