Figure 6.
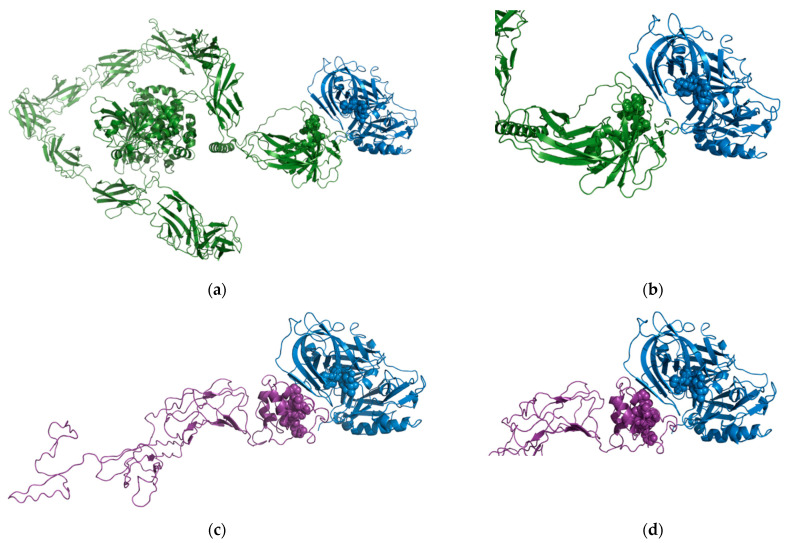
Predicted BACE1-PTPRD and BACE1-DCC interactions. (a) Overview of the predicted BACE1-PTPRD interaction. BACE1 (PDB ID 1W50) shown as blue ribbons with the active site highlighted as blue spheres and PTPRD (AlphaFold model AF-P23468-F1) shown as green ribbons with the predicted BACE1 cleavage region highlighted as green spheres. (b) Close-up of the predicted BACE1-PTPRD interaction. (c) Overview of the predicted BACE1-DCC interaction BACE1 (PDB ID 1W50) shown as blue ribbons with the active site highlighted as blue spheres and the domain of DCC predicted to be cleaved by BACE1 (modelled using I-TASSER) shown as purple ribbons with the predicted BACE1 cleavage region highlighted as purple spheres. (d) Close-up of the predicted BACE1-DCC interaction.

