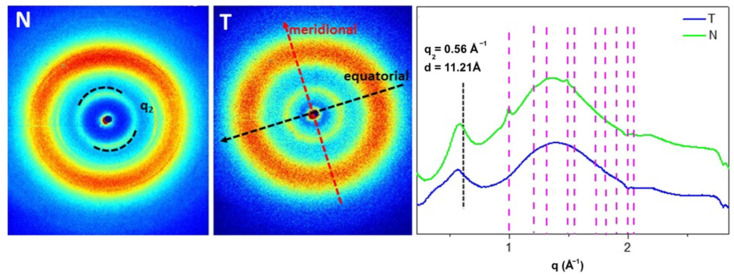
Figure 4.
On the left the 2D WAXS patterns on N and T samples. The black and the red arrows show the directions along which the equatorial and the meridional diffraction signals, respectively. On the right the 1D diffraction profiles of both samples. The equatorial peak (q2) is marked with the black line. The magenta lines show the peak positions of Ultralene sachet.

