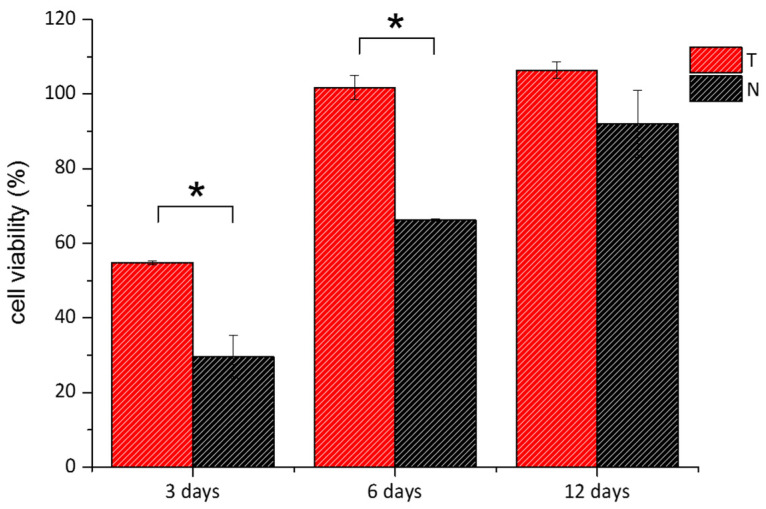
Figure 9.
MTT viability assay of 3T3 cells grown over T (red bars) and N (black bars) was performed after 3, 6, and 12 days. Data were reported as the percentage viability of the samples over the control cells (i.e., cells grown on standard plates). (*) indicates statistical significance with p < 0.01.

