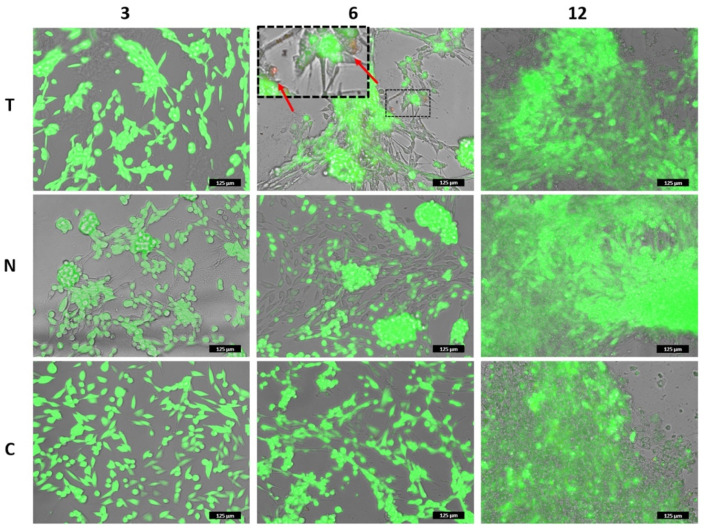
Figure 10.
Live/Dead assay of 3T3 cells grown over T and N was performed after 3, 6, and 12 days. The images correspond to the overlapped fluorescent channels (green for calcein signal and red for ethidium homodimer) and the bright field. The inset in the upper-central panel shows some dead cells among the live ones. Note: in the panels in which cells are localized on different focal lanes (elongated on the bottom plane and clustered on the upper plane), the green fluorescent channel has been slightly reduced to allow the detection of the dead cells. Please, refer to the images of Figures S2–S4 for the original signal intensity for each fluorescent channel. Scale bar is 125 µm.

