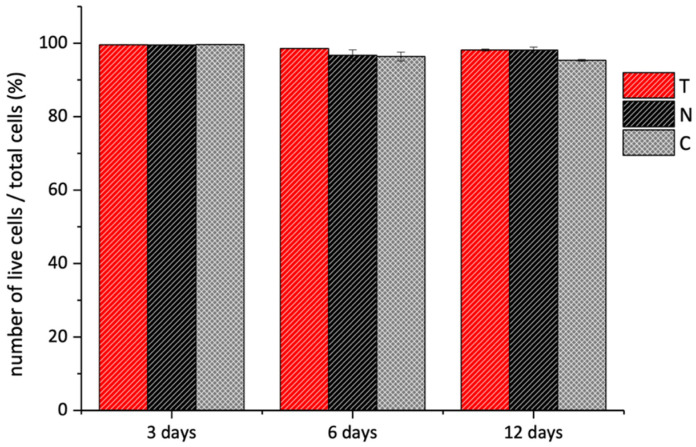
Figure 11.
Live/Dead assay of 3T3 cells grown over T (red bars) and N (black bars) substrates performed after 3, 6, and 12 days. The data are presented as the average percentage of live cells over the number of total cells. The analysis was performed through Image J Software over three different fluorescent images for each sample and measuring the green (i.e., live cells) and red (i.e., dead cells) pixels of each image.

