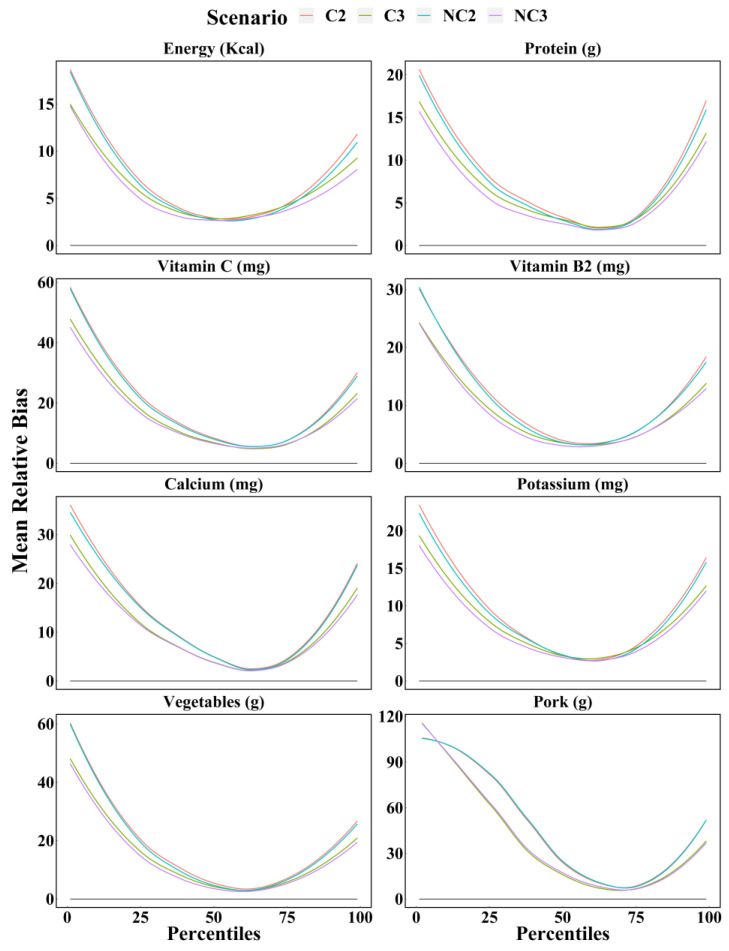
Figure 2.
Mean relative bias of the percentiles (from 1st to 99th) of intake calculated for energy, protein, vitamin C, thiamin, calcium, potassium, vegetables, and pork based on each scenario with WPM method. C2 = Two consecutive 24 h recalls; C3 = Three consecutive 24 h recalls; NC2 = Two non-consecutive 24 h recalls; NC3 = Three non-consecutive 24 h recalls.

