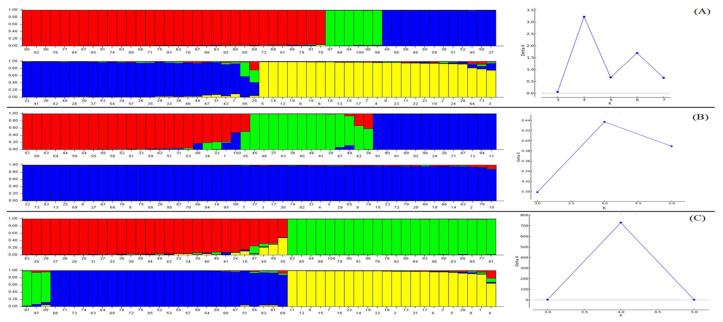
Figure 3.
STRUCTURE analysis of Triticum and Aegilops accessions, based on the SCoT (A), CBDP (B), and SSR (C) data. Bars represent the membership coefficients of samples based on allele frequencies for subpopulations. Numbers on the horizontal axes correspond to the accession numbers in Table 1.

