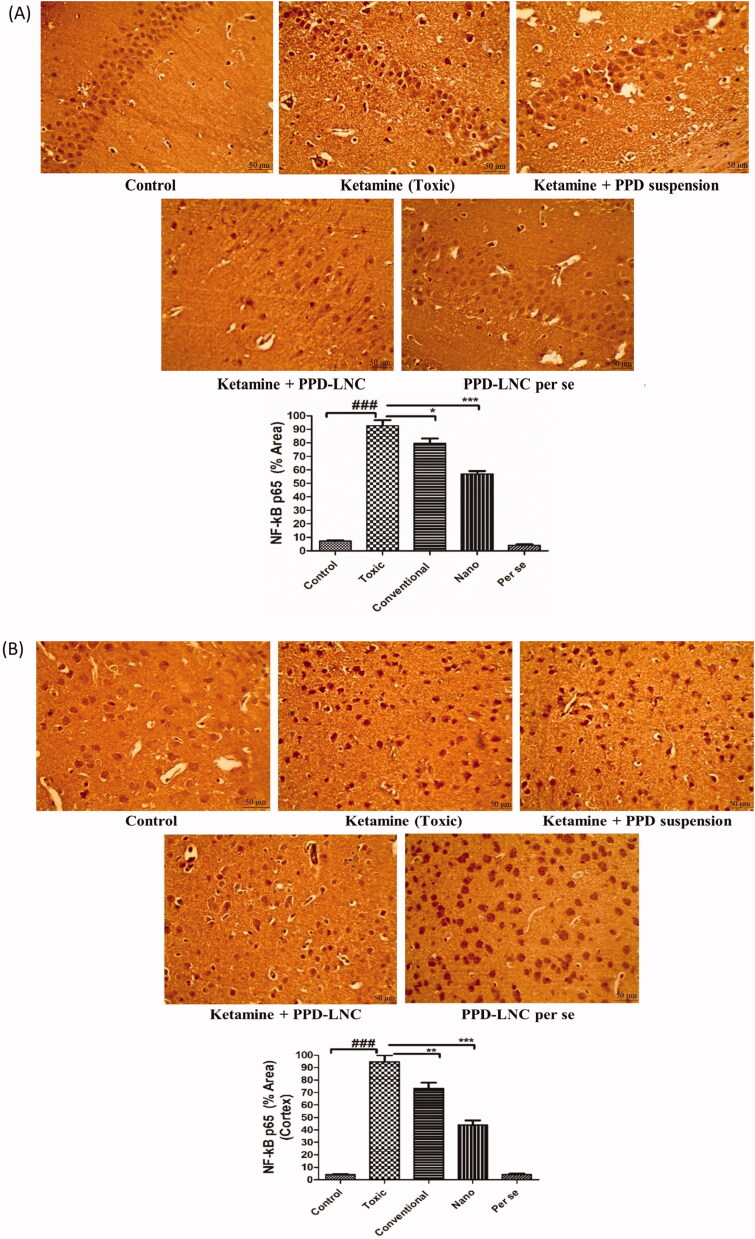
Figure 6.
(A) Images showing the expression level of NF-κB in the hippocampus when rats were treated with normal saline (control), ketamine (toxic), ketamine + PPD suspension, ketamine + PPD-LNC, and PPD-LNC per se. Graphs showing the semiquantitative analysis of different treatment groups expressed as % area. The values were expressed as mean ± SEM (n = 6), and statistical analysis was performed using One Way ANOVA, Tukey’s multiple comparison test [scale bar- 50 μm]. (B) Images showing the expression level of NF-κB in the cortex when rats were treated with normal saline (control), ketamine (toxic), ketamine + PPD suspension, ketamine + PPD-LNC, and PPD-LNC per se. Graphs showing the semiquantitative analysis of different treatment groups expressed as % area. The values were expressed as mean ± SEM (n = 6), and statistical analysis was performed using One Way ANOVA, Tukey’s multiple comparison test [scale bar- 50 μm].

