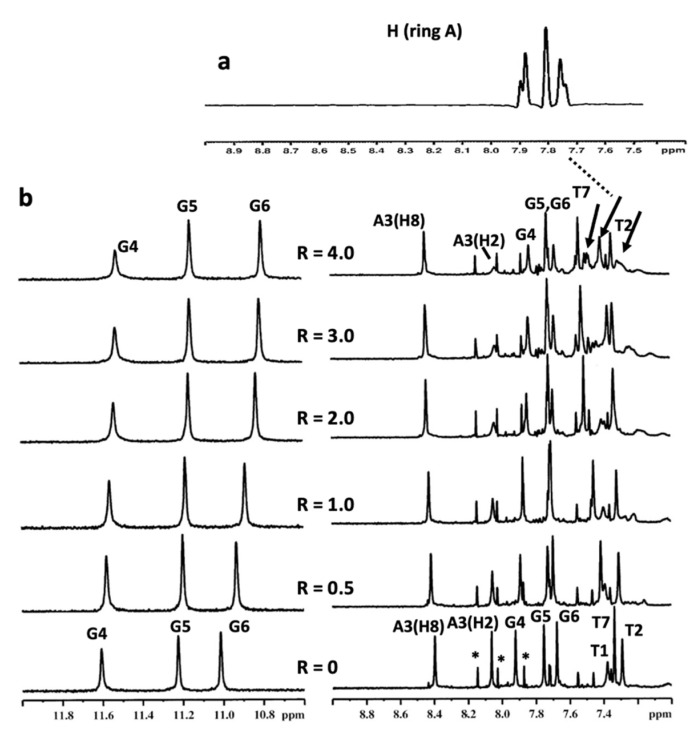
Figure 5.
(a) Selected region of 1H NMR spectrum of compound 9 at 25 °C in H2O/D2O (9:1), 150 mM KCl, 25 mM K+ phosphate buffer and EDTA 1 mM (pH 6.7); (b) imino and aromatic proton region of the 1H NMR titration spectra of d(TTAGGGT)4 with compound 9 at 25 °C in H2O/D2O (9:1), 150 mM KCl, 25 mM K+ phosphate buffer and EDTA 1 mM (pH 6.7), at different ratios R = [9]/[DNA]. The arrows indicate the broad proton signals of compound 9. The peaks labelled with * correspond to the single-strand oligonucleotide.

