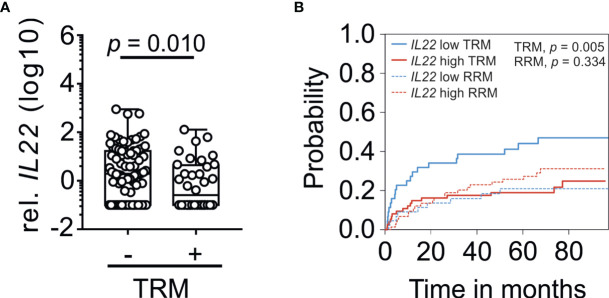
Figure 2.
IL22 expression with respect to TRM. (A) IL22 gene expression in patients grouped according to absence or presence of TRM without further subgrouping (non-TRM: n = 82, TRM: n = 36). IL22 gene expression was normalized to 18s rRNA. Box plot diagrams depict median, upper, and lower quartiles and whiskers indicate minimal and maximal values. Negative values were set to 0.1. Statistical testing was performed using Mann-Whitney U test. (B) Association of IL22 with cumulative incidence function estimates for competing risk data. Patients were dichotomized in accordance to high (red line) and low expression (blue line) of IL22 based on Youden index. The cumulative risk of TRM and RRM in dependence of the months after biopsy is shown.

