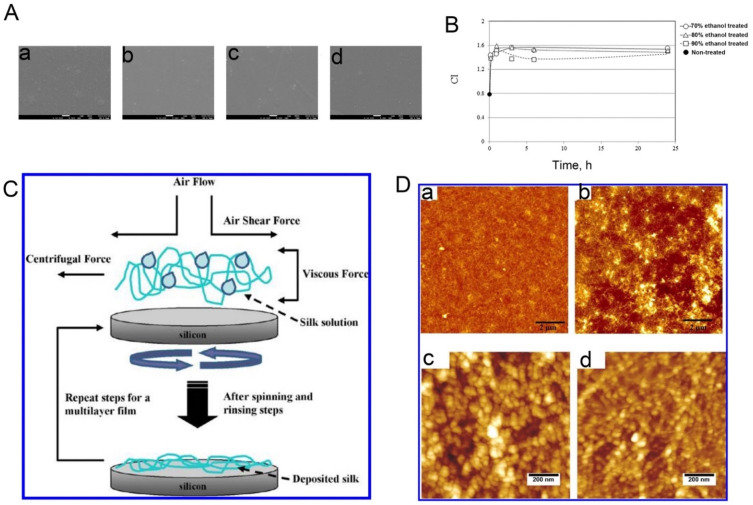
Figure 4.
(A) Field emission scanning electron microscope images of spin-coated silk films and electrospun silk fibers: (a), the as-spun coated film; (b–d), the film treated in a 70%, 80%, and 90% ethanol solution, respectively. (B) Changes in the crystallinity index (CI) as a function of ethanol treatment time. Here, the CI is the ratio between the peak intensities at 1626 cm−1 and 1650 cm−1 in the infrared spectrum. Reprinted with permission from ref. [61]. Copyright 2016 Elsevier. (C) Schematic representation of the film assembly process according to vertical deposition method. (D) Topographical atomic force microscope images at different scales of silk monolayer films (a,c) and silk multilayer films (b,d). Reprinted with permission from ref. [64]. Copyright 2012 American Chemical Society.

