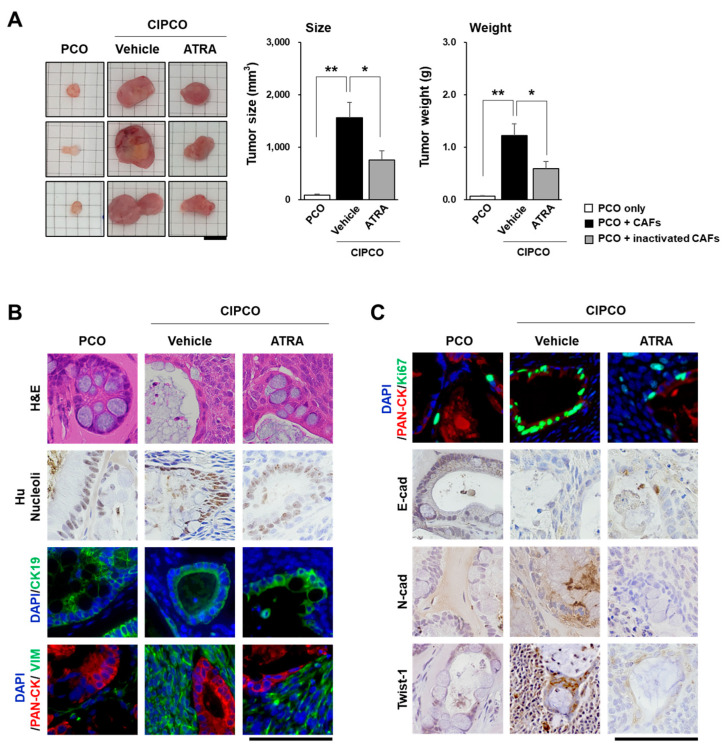
Figure 3.
Characteristics of the tumors in xenograft models of PCOs, CIPCOs, and ATRA CIPCOs. (A) Comparison of tumor size and weight between the three groups. (n = 5) * p < 0.05, ** p < 0.01. Bar = 1 cm. (B,C) Immunofluorescence/immunohistochemical analysis of PCO, CIPCO, and ATRA CIPCO xenograft tumors. Bar = 100 μm.

