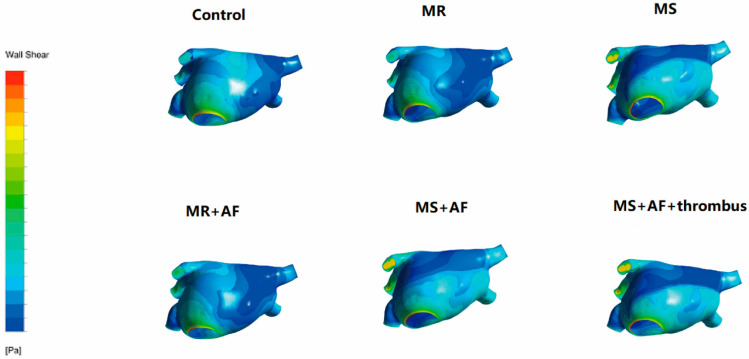
Figure 9.
TSS distribution of LA in the diastole stage in back. The color of the legend on the left side of the figure represents the decrease in TSS from top to bottom. The increase in TSS was the most significant in each group near the mitral valve, and the middle and lower part of the back of the LA. The TSS had the following order (from high to low): MS+AF+ thrombus group, MS+AF group, MR+AF group, MS group, MR group, and control group. (n = 15 each group).

