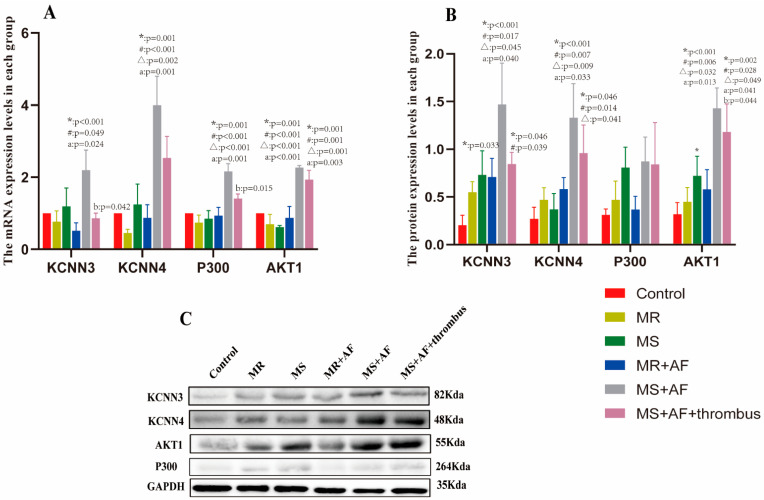
Figure 10.
mRNA and protein expression of IKCa2.3(KCNN3), IKCa3.1(KCNN4), AKT1, and P300 in myocardial specimens. (A) Mean level of mRNA expression in all patients. (B) Mean level of protein expression in all patients. MEAN ± SEM shown as bars. * significant differences from the control group; # significant differences from the MR group; Δ significant differences from the MS group; a significant differences from the MR+AF group; b significant differences from the MS+AF group. (C) A representative set of western blot.

