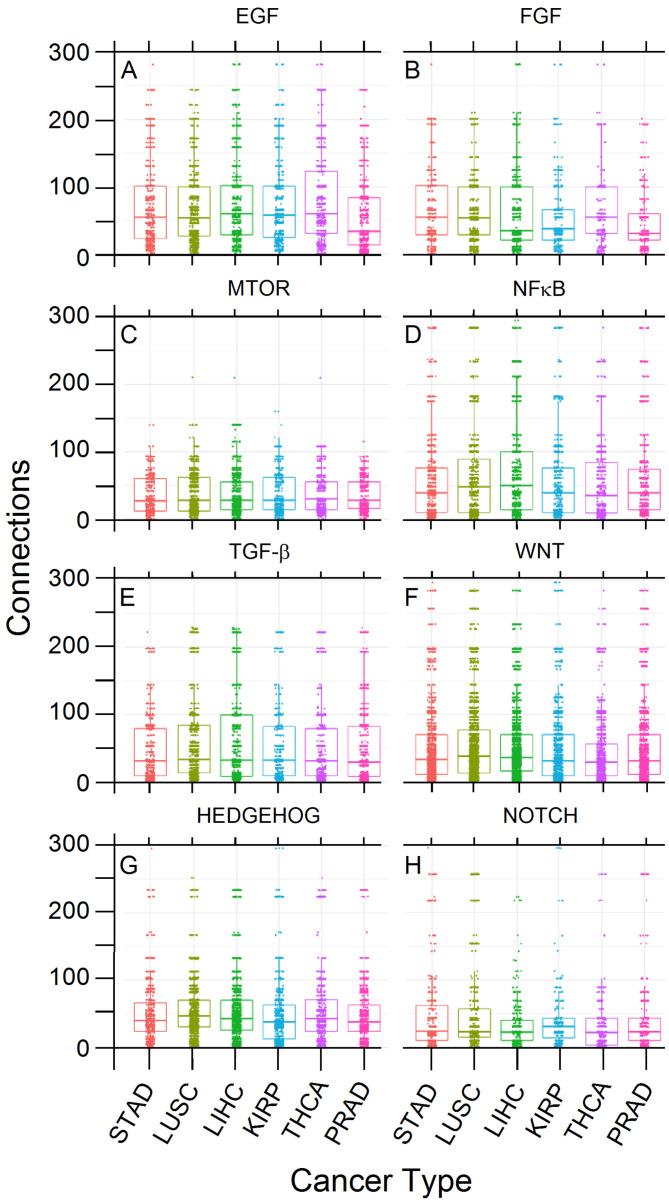
Figure 2.
Frequencies (numbers) of upregulated genes’ connections per target pathway and cancer type. The plot is faceted per pathway and by Kruskal–Wallis p-values (A): 9.1 × 10, (B): 1.9 × 10, (C): 1.6 × 10, (D): 4.9 × 10, (E): 1.4 × 10, (F): 2.9 × 10, (G): 1.4 × 10, (H): 1.1 × 10. Each value indicates a group in which the average connection count is different from the global average within that facet.

