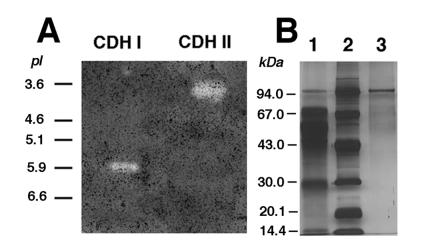
FIG. 4.
(A) Isoelectric focusing (pH 3 to 10; Bio-Rad) electrophoresis of CDH I and CDH II after the final chromatographic step. (Only part of the gel is shown.) The gel was stained with 2 mM DCPIP in 50 mM sodium tartrate buffer (pH 4.0) containing 2 mM cellobiose. Bands corresponding to CDHs were detected by clearing zones, which developed only in the presence of cellobiose. The positions of standard proteins with known pI values are indicated. The protein standard was electrophoresed on a portion of the same gel which was stained for protein. The gel was scanned (Power Lock II; UMAX) and was labeled in Photoshop (Adobe) by using an Apple Power PC 9500 computer. (B) SDS-PAGE (total acrylamide concentration, 10%; bisacrylamide cross-linker concentration, 3%; 0.1% SDS) of P. cinnabarinus CDH II after different purification steps. Protein was visualized by silver staining. Lane 1, DEAE-M column eluate (3.5 μg of protein); lane 2, protein marker; lane 3, anion-exchange (UNO) column eluate (0.3 μg of protein). Each lane contained approximately 0.05 CDH activity unit.

