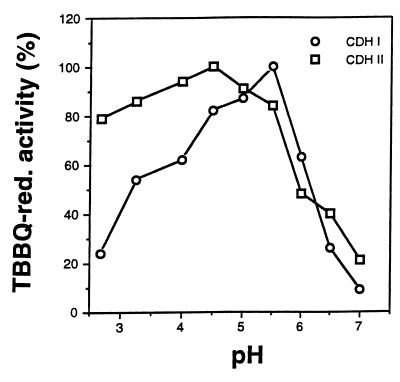
FIG. 5.
pH activity profiles of CDH I and CDH II determined with 500 μM TBBQ as the electron acceptor in the presence of 2 mM cellobiose in 50 mM sodium citrate (pH 2.5 to 3.25), 50 mM sodium acetate (pH 4.0 to 5.0), 50 mM sodium succinate (pH 5.5), and 50 mM sodium phosphate (pH 6.0 to 7.0). The values are means based on triplicate measurements; the maximal sample mean deviation from the values shown was ±6%. red., reducing.

