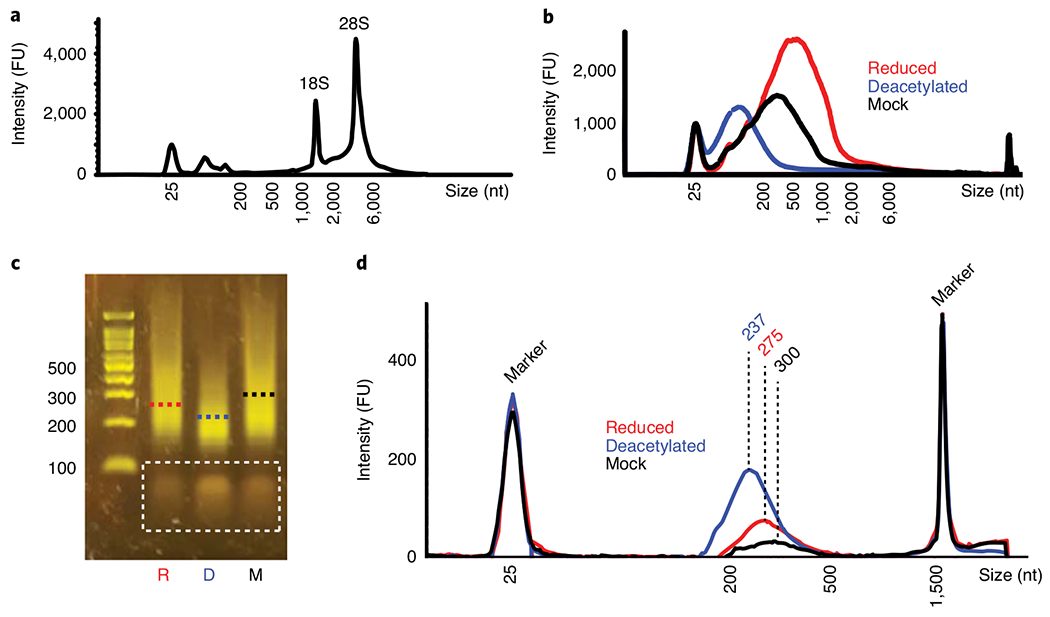
Fig. 4 |. Quality control of RNA and cDNA libraries.

a and b, Typical TapeStation-generated trace of RNA from human HeLa cells after isolation (a, Step 10) or after treatment with NaCNBH3, alkali deacetylation followed by NaCNBH3 or mock treatment (b, Step 21). c and d, Typical cDNA libraries generated from RNA of T. kodakarensis, analyzed by using E-gel (c, Step 53) or TapeStation (d, Step 64). Dashed lines indicate the mean fragment size of each library. Bands in the dashed rectangle represent leftover primers from the PCR reaction (Step 50), which are eliminated upon the final washes on Ampure beads (Step 61). R, reduced; D, deacetylated; M, mock; FU, fluorescence units.
