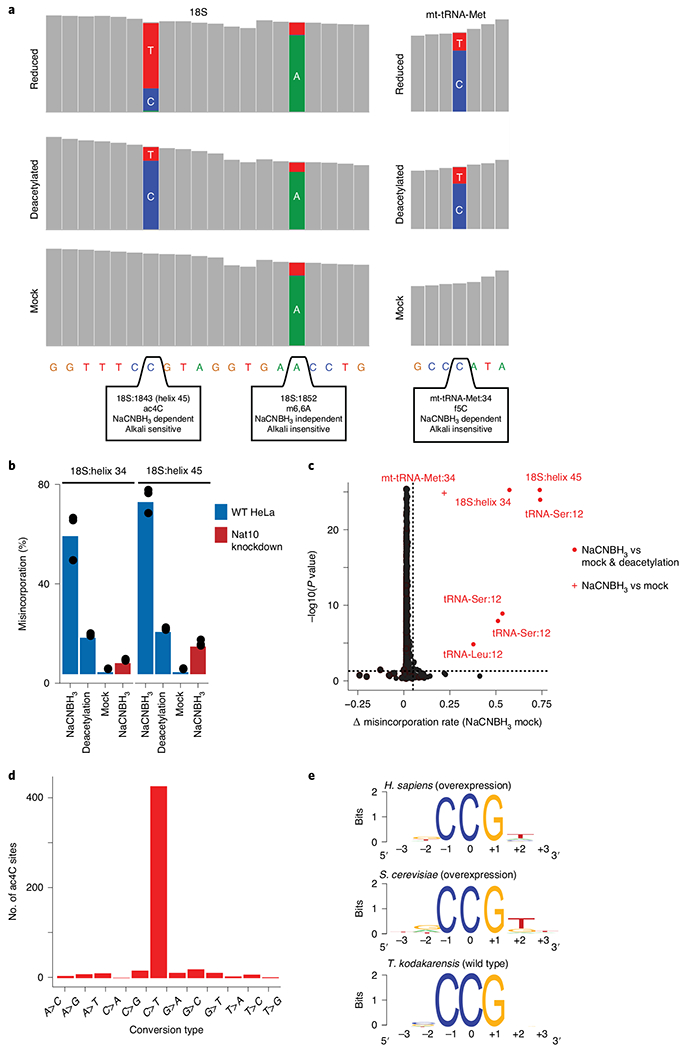
Fig. 5 |. Anticipated results of ac4C-seq.

a, Coverage tracks of regions within human rRNA 18S (left) and mitochondrial tRNA methionine (right), as depicted in the IGV browser. Positions with a misincorporation rate >1% are shown in color (blue, cytidine; red, thymidine; green, adenosine; gray, misincorporation <1%). Although both the ac4C in helix 45 of 18S and the f5C in mt-tRNA-Met are dependent on reduction with NaCNBH3 (display a misincorporation upon reduction), only ac4C is sensitive to alkali deacetylation (showing reduced misincorporation in ‘reduced’ versus ‘deacetylated’ conditions). m6,6A in 18S induces a misincorporation in an NaCNBH3- and deacetylation-independent manner and is thus similar in all conditions. b, Misincorporation rates of known sites in 18S in wild-type and NAT10-depleted HeLa cells (bars, mean of 3 biological samples; error bars, s.d.). c, Statistical significance plotted against the difference in misincorporation rates between NaCNBH3- and mock-treated total RNA from HeLa cells. Vertical dashed line, 5%; horizontal dashed line, P = 0.05 (χ2 test). n = 3 biological samples. d, Frequency of the 12 possible misincorporation patterns (y axis) found across all statistically significant sites in T. kodakarensis, showing an enrichment of C→T conversions. e, Sequence motif surrounding the ac4C sites identified in humans, yeast and archaea. Figure adapted with permission from ref. 5. f5C, 5-formylcytidine; mt-tRNA-Met, mitochondrial tRNA methionine; m6,6A, N6,N6-dimethyladenosine; WT, wild type.
