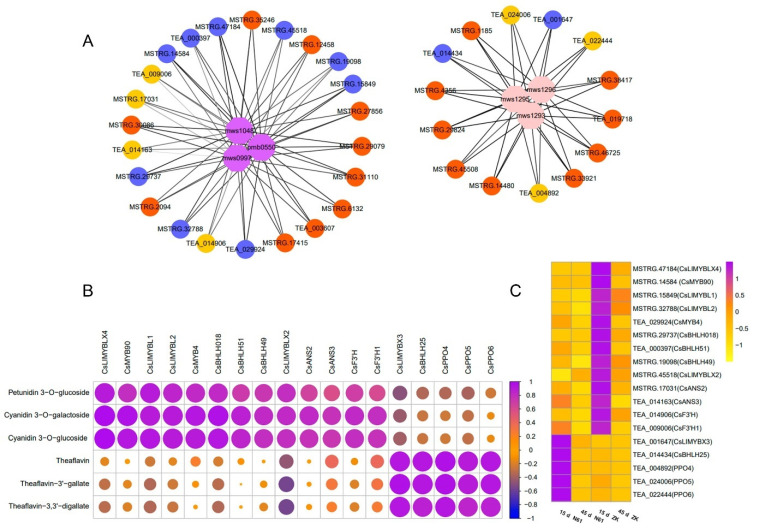
Figure 4.
Correlation analysis between genes and key metabolites of purple-leaf formation in Zikui tea. (A) Mapping of key metabolites and strongly correlated genes. mws0997, mws1048, and pmb0550 in purple are the metabolites petunidin 3-O-glucoside, cyanidin 3-O-galactoside, and cyanidin 3-O-glucoside, respectively. mws1293, mws1295, and mws1296 in pink are the metabolites theaflavin, theaflavin-3’-gallate, and theaflavine-3, 3’-digallate, respectively. Yellow represents structural genes, and light blue represents transcription factors. Unannotated genes that are highly associated with these metabolites are indicated in orange. The thickness of the line indicates the strength of the correlation. (B) Correlation analysis of 18 key genes and key metabolites. (C) Heatmap showing the expression levels of 18 key genes, n = 3 independent biological samples.

