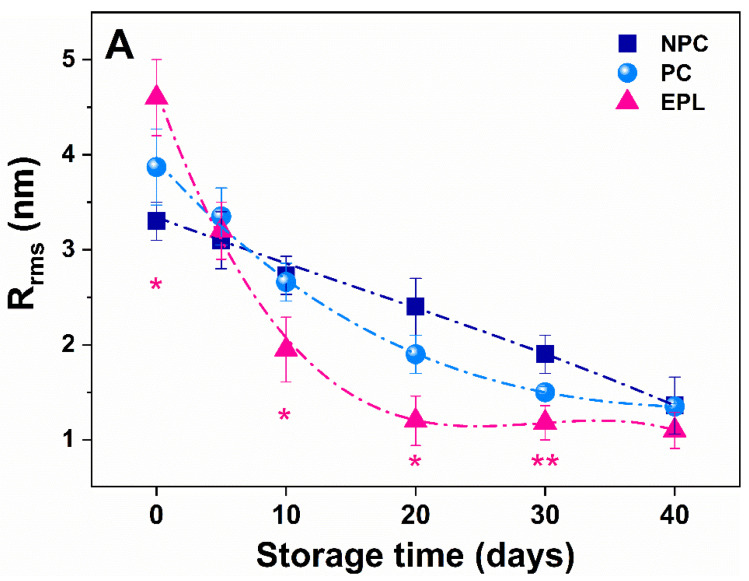
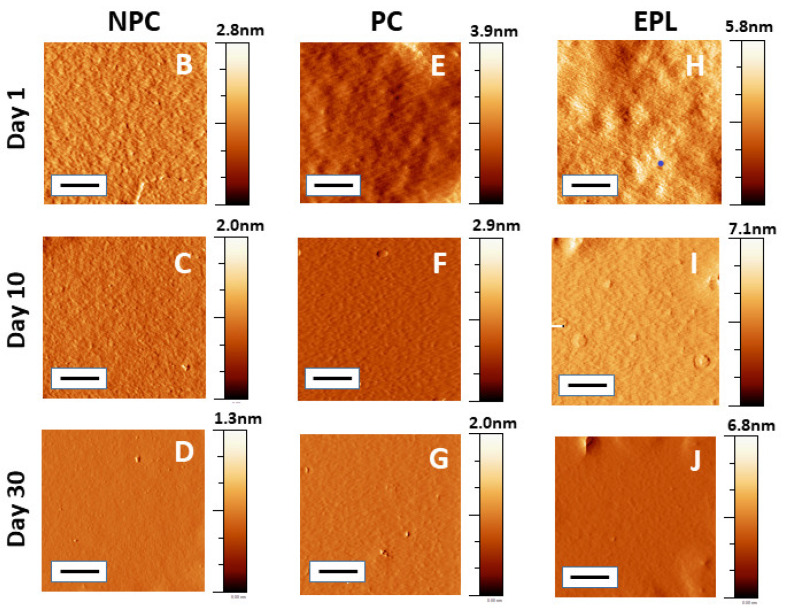
Figure 5.
The calculated value of Rrms of the plasma membrane as a function of cell storage time (A) and the ultrastructural changes over time of erythrocytes membranes of cells from nonpregnant controls (NPC) (B–D); pregnant controls (PC) (E–G); and women with early pregnancy loss (EPL) (H–J). The scale bars indicate 500 nm. Non-parametric Wilcoxon test was used to determine statistical differences in Rrms value of EPL cells, which are given as p values, indicated as * p < 0.05 relative to both NPC and PC, ** p < 0.05 relative to NPC.


